Not all statistics are created equal.
So-called “real time” stats like giveaways, hits, and blocked shots have come under fire in recent years due to their unreliable tracking and the fact they often tell you the opposite of what most people think they do. But I think the giveaway stat is the worst of all.
Since it’s defencemen who are criticized most for giveaways, let’s look at the leaders in the NHL this year in giveaways among blueliners and see what, if anything, that stat means.
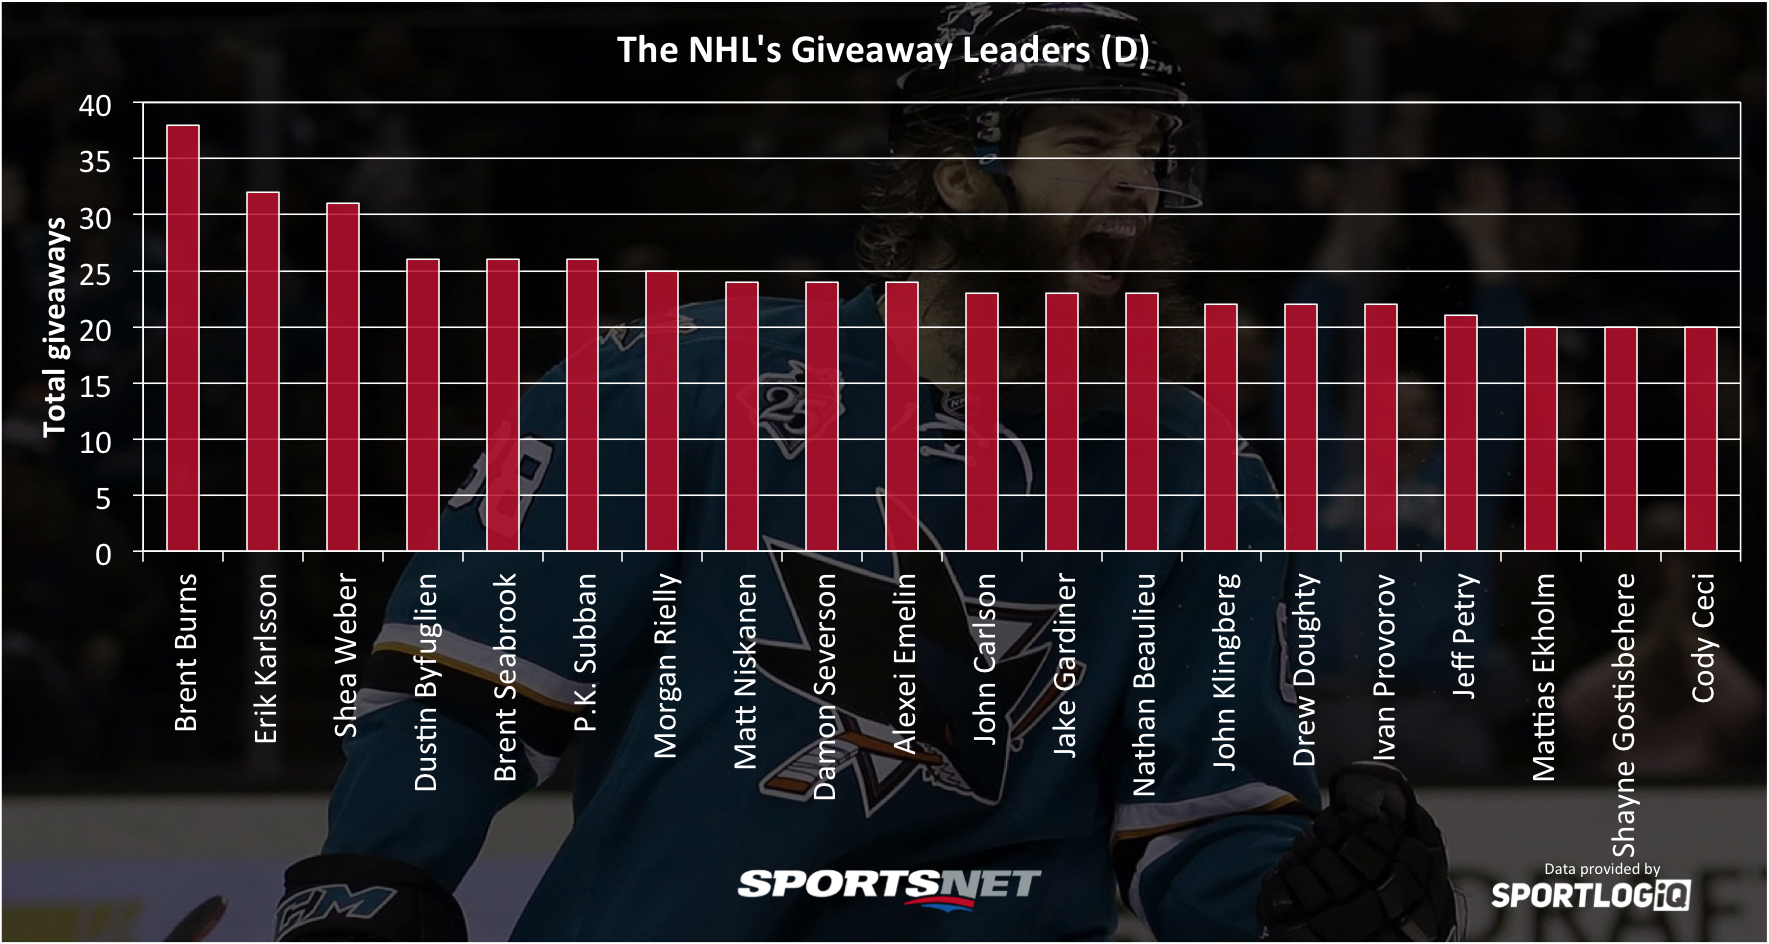
What’s apparent when you look at the NHL’s leaders in giveaways is that, for the most part, that’s a list of great defencemen. There are varying styles of play in there, but overall there aren’t many defencemen in the top-20 who you would consider “bad” at the position.
This leads to the assumption that players who give the puck away a lot are simply those who play with it on their sticks more often than others, which is partially true, but I want to go a step further. The NHL’s giveaway stat isn’t just without context; I’d argue it’s completely inaccurate to the point of not mattering at all.
Hockey is a dynamic game, more than most people know. Take Brent Burns for example — he has handled the puck 2,186 separate times this season. If he had given away the puck just 38 times as the NHL suggests, it would mean he only gives the puck away on 1.7 per cent of his plays. If this were actually true, hockey would be a game of extremely long, dominant possessions instead of the rapidly back and forth chaos that we all know. The gap between the player who gives the puck away the most and the player who gives it away the least would be just 1.7 percentage points.
The better terminology we should focus on is turnovers; essentially any play a player makes that ends up with the opposition possessing the puck. Turnovers are a function of a few things: how often a player handles the puck, how much ice time a player gets, how good a team’s structure is to provide options to that player, how difficult the type of play a player makes is, and how good a player is at making those plays.
Using each player’s individual turnover rate without accounting for their teammates, combining it with how often they play the puck, we can find which players have turned the puck over the most this season.
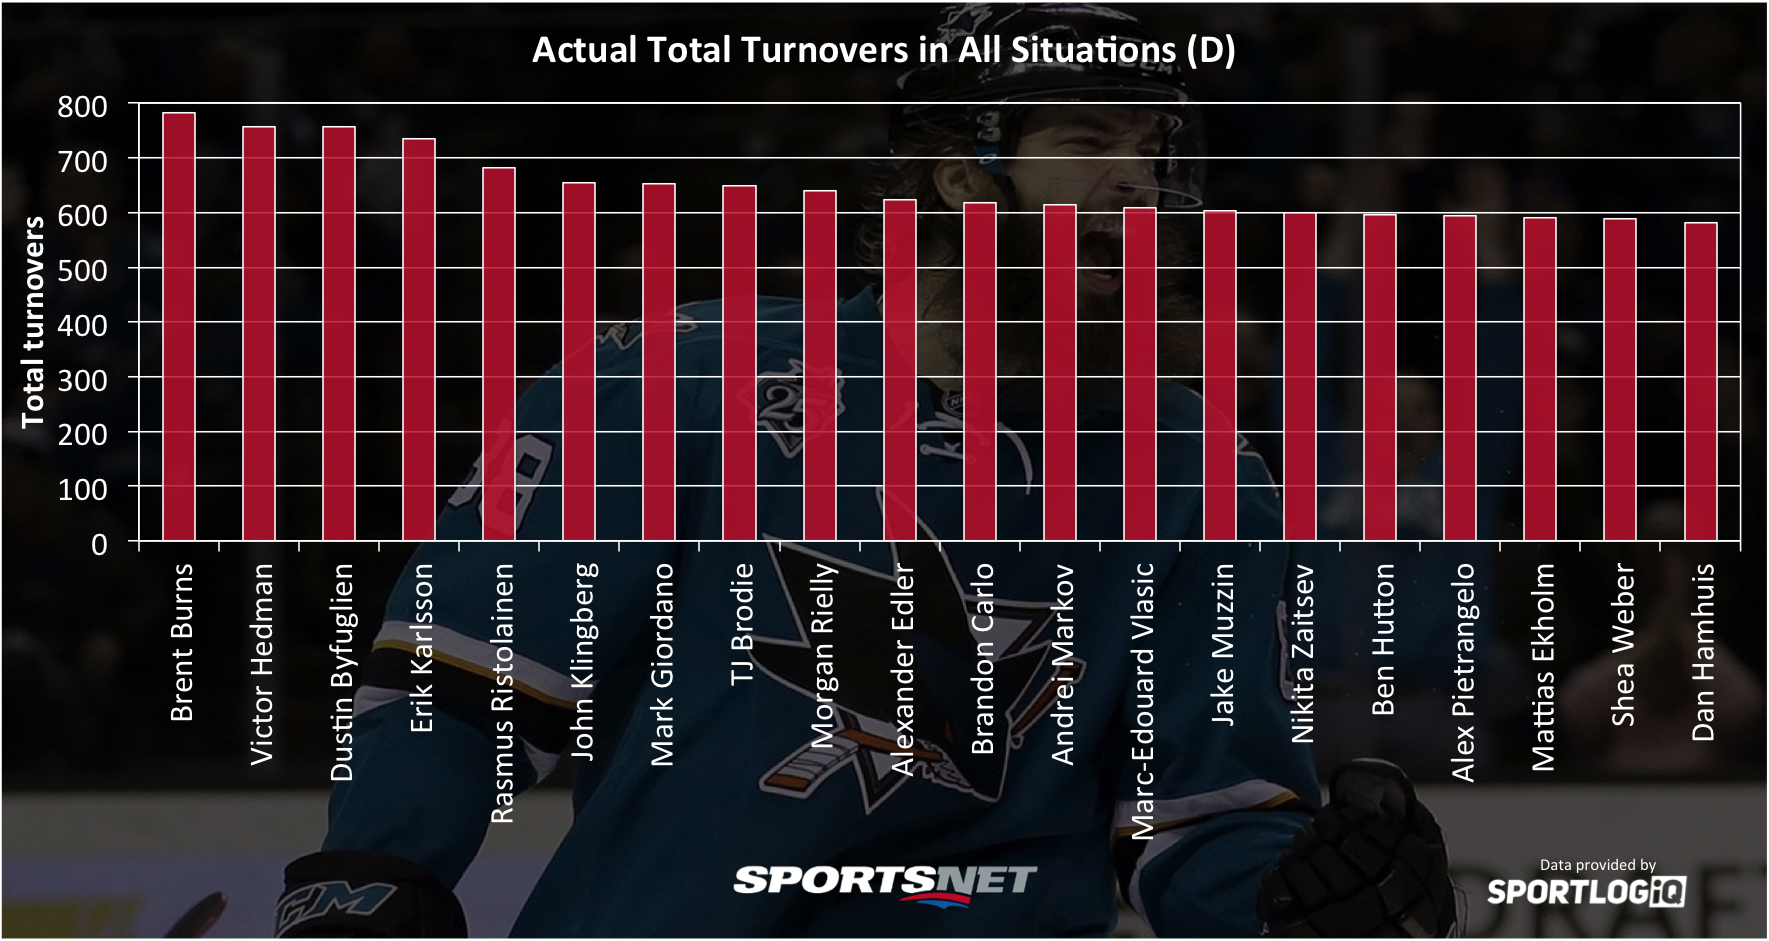
As you can see, when we compare turnovers to giveaways, the sample size increases by about 20 times, which doesn’t just make more sense, it gives us a more reliable sample with which to determine value.
While Brent Burns and Dustin Byfuglien remain high on this list, most of the rest of it has changed. But what should we draw from this information? This list once again has a lot of great defencemen on it, and most importantly, they are defencemen who are heavily relied upon by their teams. Do the raw totals actually mean a player is risky?
In the future, adjusting for difficulty of plays players are making will be the next step forward, but right now the most informative thing you can do is adjust for a player’s team structure. If a player has a higher than average turnover rate, they aren’t necessarily a risky player if their team has poor structure. For example, the Maple Leafs’ Connor Carrick has a turnover rate of 33.1%, higher than the league average of 31.1%, but lower than the Leafs’ average of 34.3%. Is he a risky player? I would say no.
So if we adjust for team structure, the assumption should be that players with turnover rates better than team average should be good, skilled players, so how do the top-20 look?
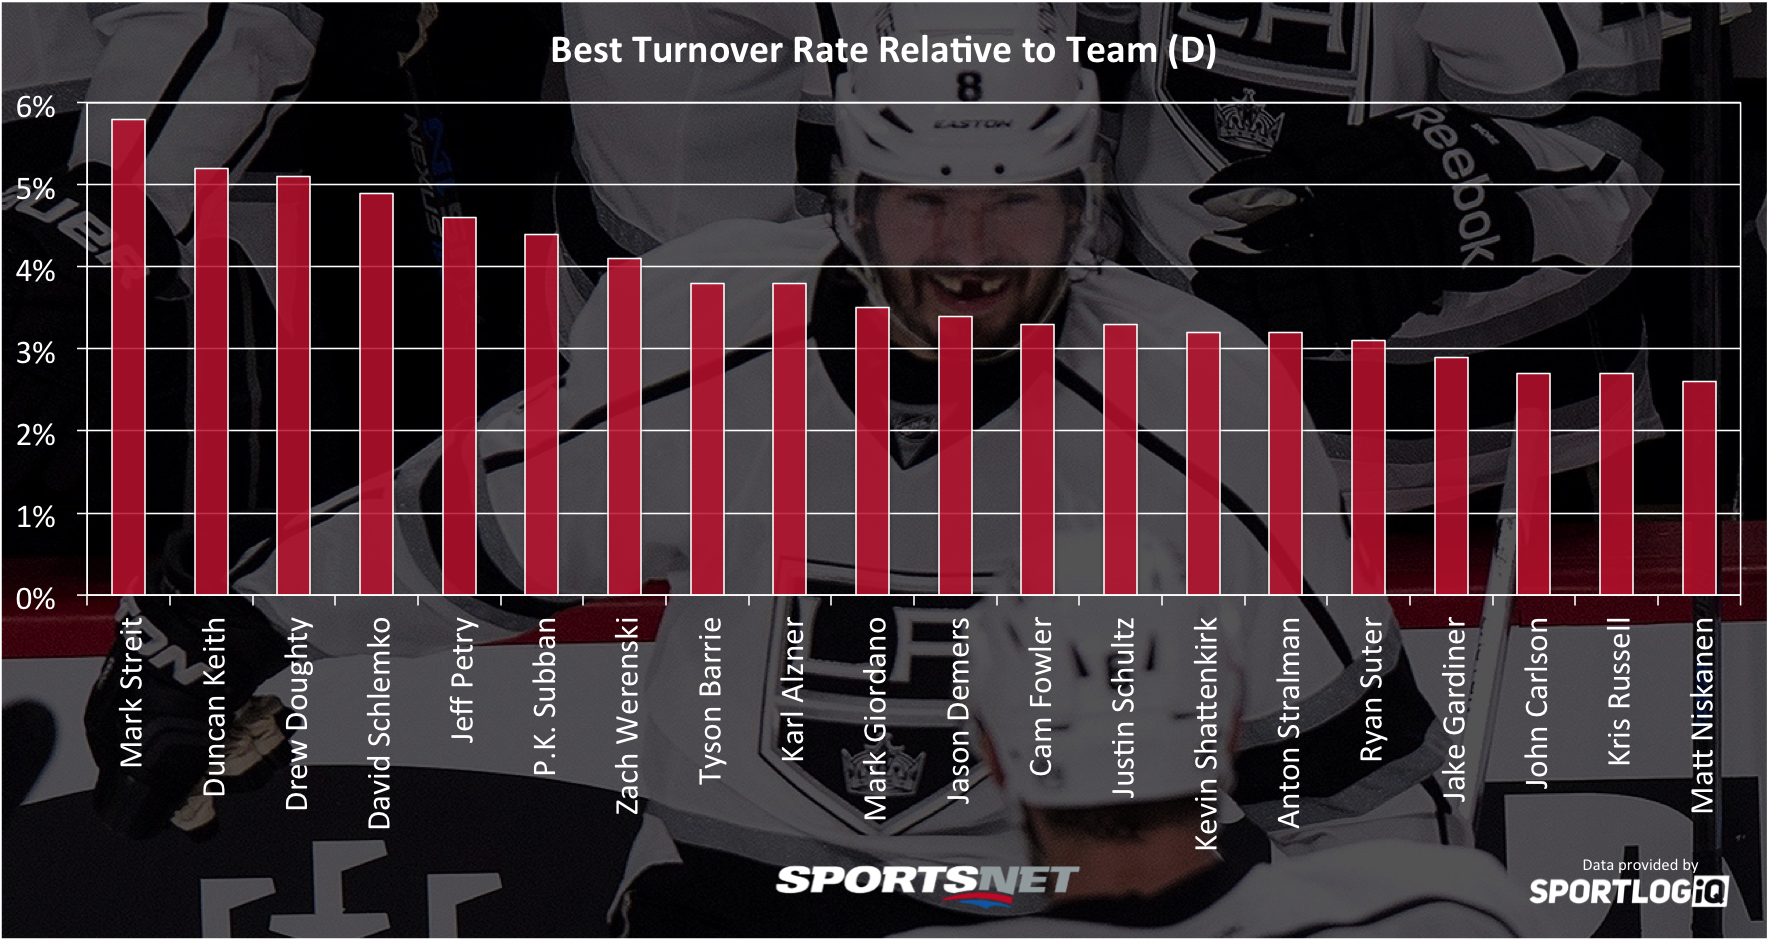
(Carrick would sit at 1.2% on this chart)
There are a couple surprising names in there, mainly Justin Schultz, but the season is young and he is much improved in Pittsburgh. What’s important to note is that the players who stick out as safe with the puck are mostly big-minute eaters who are trusted by their teams. Ironically, some of these players show up in the NHL’s giveaway leaders, even though they turn the puck over far less than most.
Now what about the worst players?
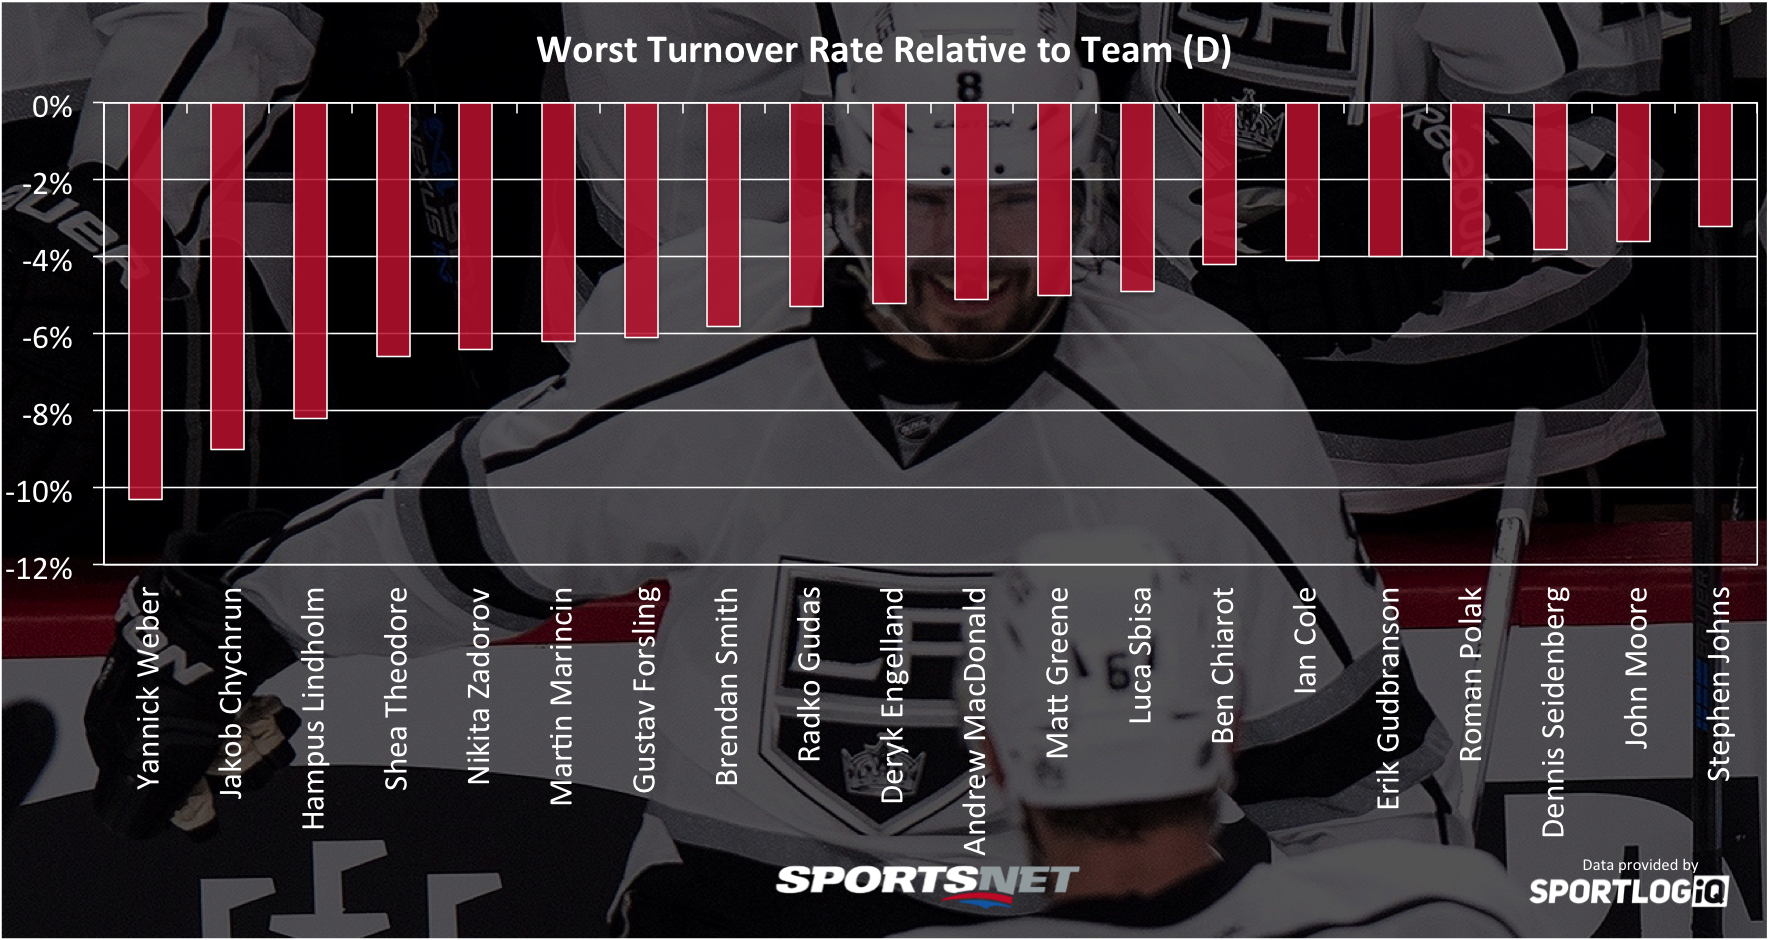
With the exception of Hampus Lindholm, who is still getting up to speed after sitting out a good chunk of the season before signing a new contract, the worst defencemen for turnovers are mostly who you would expect. Rookies, veterans who are on the fringes of lineups, and immobile defencemen who struggle to move the puck.
These are the truly risky defencemen in the NHL, but they don’t end up on the NHL’s giveaway leaders list because they’re not trusted to play a lot, even when they do they’re not heavily involved with the play, and the way the statistic is recorded is unreliable.
So don’t read too much into the NHL’s giveaway stat because it can be misleading and isn’t representative of who the truly risky players are, versus the good defencemen who play a lot of minutes. To get value out of analyzing turnovers, you have to dig a little bit deeper.