

We are often led to believe that, at certain points in the season, some games “matter” more than others. When you consider the fact that the NHL season lasts 82 games and any given month can feature 10-14 contests—roughly 15 percent of the season—it seems odd to think that one month can make or break a team. Practically speaking, no single month should. But every night, we accumulate information. And the things we see in the early weeks of the campaign tell us something about where teams are likely to end up when all is said and done.
Since the 1989-90 season, 45 teams have opened with nine or more wins in October—so either playing well or playing lucky. Of those, four registered 11 wins and all made the playoffs, as did 10 of the 11 that had 10 wins. On the whole, 26 (57.7%) ended the regular season with 100 or more points, and 39 (86.7%) qualified for post-season play.
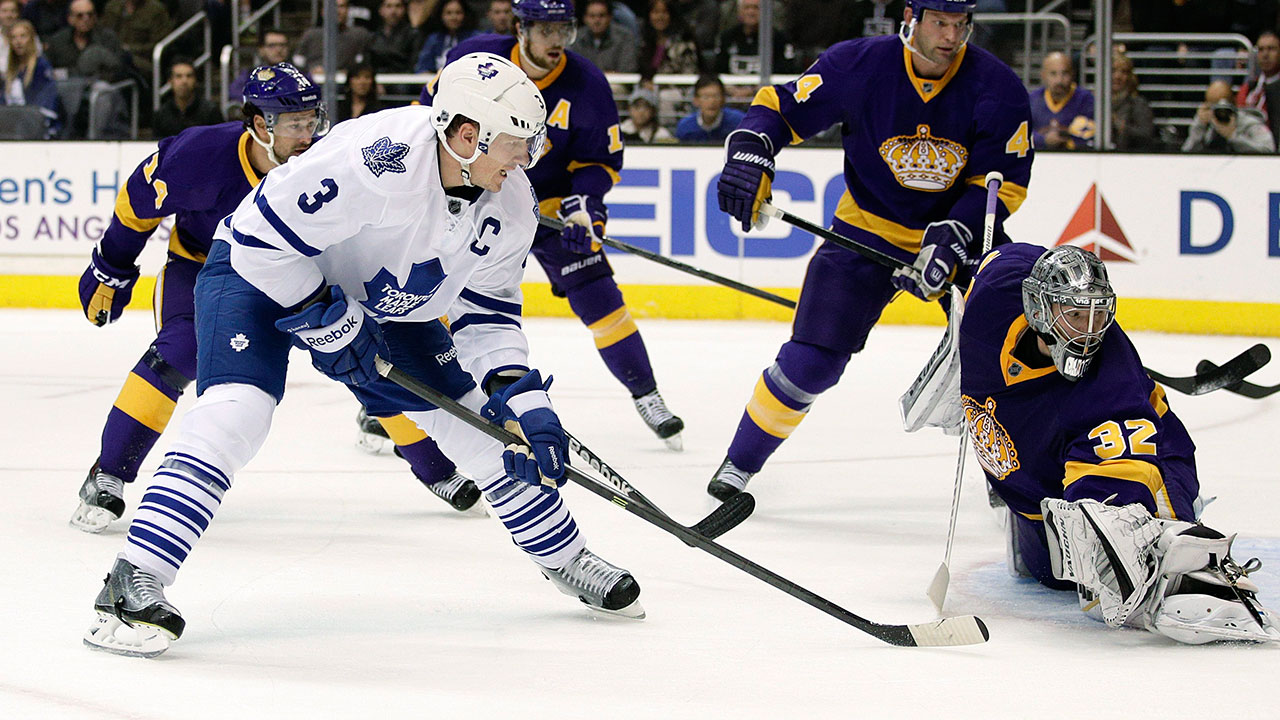
Last season was actually odd due to the large number of teams that got off to a very good start. Eight won nine or more games in October. That group included the Leafs, Canucks and Coyotes, none of whom made the playoffs. But it also included the eventual Stanley Cup-champion Kings, the Ducks, the Western-Conference powerhouse Sharks and the Penguins, one of the top two teams in the East. The eighth team—the Avalanche, who went 10-1-0—is shaping up to be one of the most interesting stories of 2014-15.
More NHL on Sportsnet:
Subscribe: Rogers GameCentre Live
Rogers Hometown Hockey | Broadcast Schedule
Early in the season luck (or random unexplained variance) actually plays a more significant factor in the NHL standings than any other variable. Teams do get lucky, and it affects the standings significantly. But as the season wears on, those teams tend to fall by the wayside, it just takes a while for things to even out. And if they get lucky enough for long enough they might not fall all the way off (after all, the season ends at 82 games).
When teams start the season with a killer October, it makes them far more likely to make the playoffs . But that isn’t always a certainty, so we really shouldn’t rely solely on wins and losses if we’re trying to make future predictions—we should make use of all the information we have.
Now, last season I was one of many people predicting the Leafs’ demise despite a hot start October start of 10-4-0. And that was because of the underlying play that was actually driving their record. You have to consider whether teams are getting results based on possession and scoring chances, or a lot of lucky bounces.
[polldaddy poll=8357998]
PDO is the sum of a team’s Even Strength shooting and save percentages. It regresses towards a team’s underlying “skill” level over the long term—usually close to 1000. Teams with really strong shooters or goaltending can sustain numbers above 1000, but anything well over 1020 or under 980 is unlikely to last for long. The Leafs have sustained the top 5v5 SH% the past four NHL seasons at 8.73%, but their goaltending over that time has been right around NHL average at .9208. That gives you an underlying PDO of 1008.1—so the Leafs should expect their number to end up around there when the season ends.
That 10-4-0 October start by the Leafs last year was smoke and mirrors. They were winning with the second-highest PDO in the NHL for the month (1040.2). Even with improved goaltending from Jonathan Bernier and a hot month from James Reimer nobody should expect a .941 SV% at 5v5 to last, and the team was shooting 9.96%. By way of comparison, look no further than the Kings, who went 9-5-0 in October with a PDO that was 28th at 972.3. Their “puck luck” was only likely to improve, and thus they were more likely to win games, not less. We can see how that actually played out by looking at both teams’ PDO for the remainder of the 2013-14: Toronto’s settled back down to 1006.7 (still No. 8 in the NHL, but far less ridiculous), while Los Angeles saw its rebound to 1007.3 (seventh for the remainder of the year).
Similar to PDO, possession numbers can also be used to project how teams will perform after hot starts. When you look at their Fenwick and Corsi rankings, the Kings strength at possession was obvious. In the month of October, L.A. ranked first in Corsi (57.29% CF%), and second in Fenwick (56.74% FF%). The Leafs ranked 30th in Corsi (42.75% CF%) and 30th in Fenwick (41.39% FF%).
No #Leafs skater had a FF% over 46% last year… that HAS to change this year
— Stephen Burtch (@SteveBurtch) October 7, 2014
The Kings went on to finish first Corsi for the rest of the season (56.73% CF%) and Toronto ranked 30th (42.84%). L.A. actually improved to first in Fenwick for the remainder of the year (55.96%) while Toronto maintained it’s dead last ranking (42.37%). The Kings won their second Stanley Cup in three years, while the Leafs failed to make the post-season for the seventh time in eight seasons. And became the only team in the past 25 years to finish October with 10 wins and not qualify for the post-season.
So if you see a team shoot out of the gate this month, try to remember that underlying luck and possession metrics might tell a slightly different story than what we see in the standings.