

Call it the great tightening, but don’t call it a drought. As parity increases across the NHL and changes in how the game is played take hold, the high-flying scoring numbers of past eras are all but gone.
Viewed in this light, Alex Ovechkin and his consistent 45-plus goal production is all the more awe inspiring.
Being one of five skaters in NHL history to hit the plateau seven times is extremely unique performance-wise, and doing so in the modern era of the game is nothing short of legendary.
Here’s why.
First, an assessment of the current state of affairs. Assuming they play all of their teams’ remaining games, this season’s leading scorers, John Tavares, Ovechkin and Sidney Crosby are on track for 83, 85 and 86 points. Those would be the lowest top-end scoring numbers in a non-shortened season since Gordie Howe led the NHL with 86 points in 70 games in in 1962-63. Crosby’s 1.111 pts/gp would be the lowest leading rate since Maurice Richard’s 1.105 in 1954-55.
While those numbers are eye-popping, they should not set off off alarms of concern that NHL offence has returned to pre-expansion scoring rates. While upper-echelon players are scoring less, goal-scoring rates at the team level have remained relatively constant—around 2.72 goals per game the past four seasons. The main underlying feature of the decline in individual production is in fact a return to the the type of parity in talent and coaching that was a highlight of the NHL’s Original Six glory days.
 Sportsnet Magazine’s Toronto
Blue Jays Special: From the heart of the order to the bottom of the bullpen, we’ve got this team covered in our preview issue. Download it right now on your iOSor Android device, free to Sportsnet ONE subscribers.
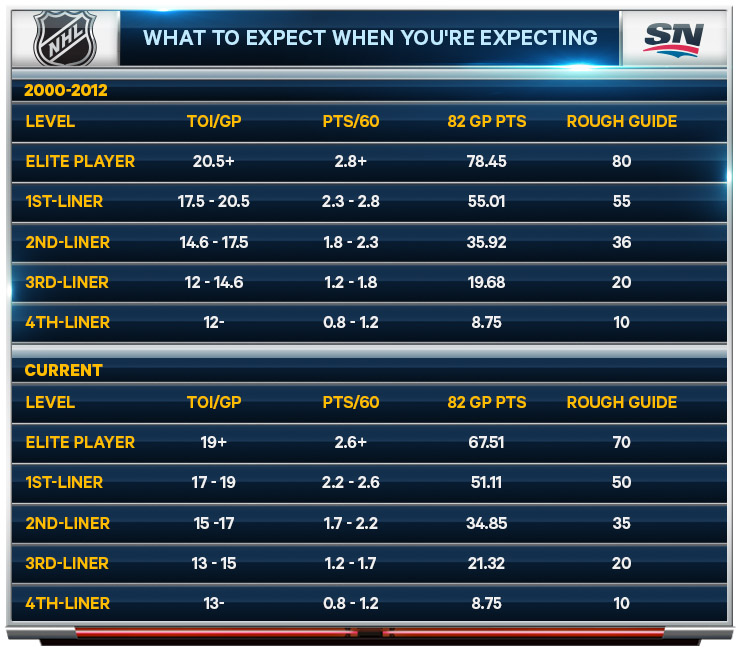
Scoring rates and time-on-ice data available since the late 1990s show how spread out offensive talent actually is. Aside from a single-season blip following the 2004-05 lockout, points-per-60-minutes rates among forwards have held fairly steady for the past 16 years. This tells us that the talent level hasn’t decreased, nor is the defensive ability of individual skaters miraculously increasing.
What we are seeing, though—and it shouldn’t be assumed to be a long-term trend—is a narrowing of the gap between top-end talent and third- and fourth-liners around the NHL. The difference in production between the top and bottom 25 percent of forwards is the lowest it has been in 16 years: 0.975 pts/60, with elite forwards (the top 10 percent) scoring more than 2.59 pts/60. The largest spread in the time frame occurred in 2005-06, immediately following the lockout, when the gap was 1.246 pts/60 and elite forwards were producing more than 3.25 pts/60.
That spike in scoring was quite obviously linked to the jump in power plays during the obstruction crackdown. Since there has been a steady increase in five-versus-five game play as a balance has been found and teams have become more keenly aware of the advantages and disadvantages of special-teams play. The increased pace of the game and higher demands for speed and skill have also cascaded through the NHL. Bottom-six forwards are expected to maintain possession and contribute offensively, which is leading to a decline in more specialized roles for players like enforcers.
Carrying fewer players who require sheltering coupled with an increasing emphasis on even-strength play means teams are forced to roll all four lines if they hope to compete. That’s particularly true if they are planning on a lengthy playoffs, which more teams are thanks to increased parity. It all means the distribution of ice time for forwards is leveling off considerably. So in the late ’90s, the top 15 percent averaged upwards of 21 minutes and the bottom 15 percent 8.5. These days those times are fewer than 19 minutes and nearly 11.
So generally speaking, everyone is playing closer to the average amount of time available, which is leveling the playing field.
This presents a bit of a quandary because it implies that individual production rates, while lower, aren’t actually out of line with what should be expected based on how the game is being coached and played. The underlying rates of offensive performance haven’t shifted significantly, but the amount of time players are skating in advantageous scoring situations is being reduced. So we may not see many 50-goal or 100-point producers any more, but that doesn’t equate to a talent drain. What it means is we need to alter our expectations of what it means to be a top scorer.
We shouldn’t spend less time celebrating individual accomplishments relative to past eras. We just need to remain keenly aware that producing a 50-goal or 100-point campaign in the modern NHL is an exceedingly rare accomplishment—hitting the 40-goal or 80-point plateau is where the new standards may need to settle.
Lets adjust our views accordingly and acknowledge the greatness we’re seeing in players like Ovechkin as it happens.