
Dustin Penner was a big man with reasonably good hands during his time with the Oilers. He took 481 five-vs.-five shots with the goalies in and scored 56 goals, a shooting percentage of 11.6 percent. Forwards average between 9 and 9.5 percent, so Penner’s is a very good number. It’s not a huge shot volume—7.5 5v5 shots/60—but it’s right around the league average. As far as scoring goals, he can be fairly described as an average player in terms of volume of shots, but above average in terms of finish.
At the 2011 trade deadline, Edmonton traded Penner to Los Angeles. There was a slight bump in his shot volume during his time in Los Angeles—8.2 S/60 at 5v5—but his 5v5 shooting percentage was more than halved—from 11.6 to just 5.1 percent. As a result, Penner’s goal production pretty much disappeared—he scored just 10 goals at 5v5 on 197 shots in 117 games. That’s a massive drop from 25 goals over his final 197 5v5 shots in Edmonton.
That seems like a very unusual thing to happen. Guys with hands don’t generally see those hands disappear in their late 20s. What’s more, other things that might have suggested that Penner had lost his game didn’t really seem to be present—he made his team better in terms of its share of the shots when he was on the ice in Los Angeles and he was still taking around the same volume of shots as he’d taken in Edmonton. Only one specific (albeit very important) facet of his game disappeared—putting pucks in the net. To look into this, I assembled a group of forwards who a) took at least 300 5v5 shots between 2007 and 2011, at a rate of between 6.0 and 9.0 S/60 and b) shot between 10.6 and 12.6 percent. Basically, this is a group of players who had a goal-scoring profile at 5v5 that was comparable to Penner’s. I then looked at how they did from 2011 to ’13. Penner’s numbers are split between his time in Edmonton and Los Angeles—every other player on this list has their numbers split between the 2007-08 and 2010-11 seasons and 2011-12 to 2012-13 seasons.
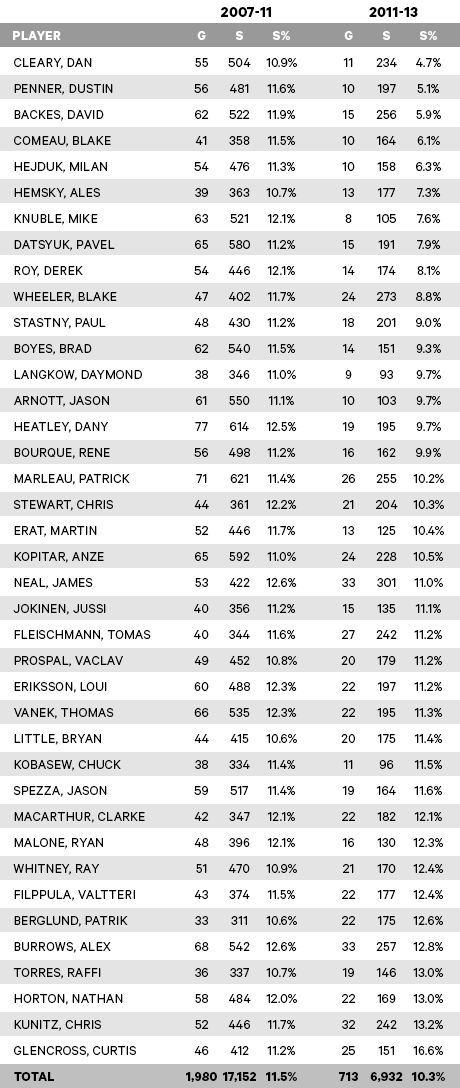
This group of players provides a textbook example of a phenomenon known as regression to the mean. A player’s shooting percentage is a mix of skill and luck and when you take a group of players who were well above the mean in terms of shooting percentage, as this group was from 2007 to 2011, you can expect them to collectively be closer to the mean going forward. From 2007 to ’11, they shot 11.5 percent. From 2011 to ’13, they shot 10.1 percent. This group of players is probably better at finishing at 5v5 than the average NHL forward, but not by the margin that their 2007 to ’11 performances suggest.
One of the quick and dirty tricks to determine whether something is really unusual is to ask how likely it is that we’d see something like Penner’s 5.1 percent 5v5 shooting percentage over 197 shots by chance alone. It’s important to consider this because if we observe something that is quite possibly chance, it’s silly to burn brainpower worrying about it or (and keep this in mind) to weight what we’ve observed too heavily in evaluating the player. There’s a mathematical way of estimating this. If you assume that Penner had the average finishing ability of his group in the 2011 to ’13 period, you’d expect him to shoot 5.1 percent or worse over 197 shots about one time in 117.
It’s unusual enough that you might consider whether there was something else happening—that maybe we were wrong to assume Penner had a shooting-percentage talent of 10.1 percent. There are circumstances you can imagine in which this would almost certainly be true. If, for example, Penner broke his arm and was in a cast during the entire time he was in Los Angeles, it would be reasonable to suspect that our assumption that he should shoot 10.1 percent was inaccurate. Another circumstance in which that might be the case is if Penner was taking lower quality shots in Los Angeles than he was in Edmonton.
Sportsnet’s Chris Boyle has been developing a fascinating lens through which to improve objective evaluation of goalie performance. He’s yet to publish it in detail but it seems theoretically sound. Essentially, Boyle places shots into one of four categories: clean shots, on which the goalie is set, transition shots, on which the goalie is moving to react to a lateral pass, rebounds and deflections. He’s found that save percentages on clean shots are considerably higher than on the other types of shot.
Obviously, the opposite would be true of shooting percentages—a player who takes more shots on which the goalie is set would be expected to score fewer goals, all other things being equal. There’s video available of 187 of Penner’s final 197 shots at 5v5 in Edmonton and 188 of his 197 5v5 shots in Los Angeles. If you classify each of those shots, you find the following:
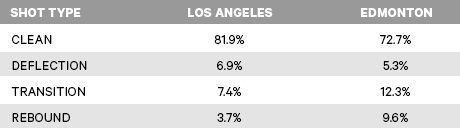
The key number is the big difference in clean shots. According to Boyle, those shots go in about 4.9 percent of the time. The other types go in 27.5 percent of the time. During his time in Los Angeles, Penner turned about nine points worth of the high-percentage shots into low-percentage clean shots. Assuming Boyle is correct, it seems sensible to expect Penner to have scored fewer goals in Los Angeles than he did in Edmonton. In Los Angeles, Penner scored on seven of 34 non-clean shots (20.6 percent) as opposed to 14 of 51 in Edmonton (27.5 percent). This is a small enough difference that it could easily be due to chance. The change on his performance on clean shots is a lot harder to justify that way—Penner scored three goals on 154 clean shots in Los Angeles (1.9 percent) compared to 11 on 136 in Edmonton (8.1 percent).
All of this gives rise to a critical question: “Why?” Why did Penner end up with a greater proportion of his shots in Los Angeles being clean shots as opposed to in Edmonton? And why did so few of his clean shots result in goals in Los Angeles?
Intriguingly, Penner’s not alone in having shooting percentage problems in Los Angeles—from 2011 to present, the Kings have shot 6.6 percent on 3,770 5v5 shots. League average is about 8 percent. It sounds like a small difference but it amounts to an extra 50 goals over 160 games or so, which is substantial. It may well be that there’s something about the way in which Los Angeles attacks that results in shots that have a reduced chance of ending up in the net. A team that invested in generating good data and in working to quantify the types of shots that are more dangerous might be in a better position to have identified a guy like Penner last summer as someone who might bounce back if put into more favourable circumstances.
Penner is, of course, off to an excellent start in his second tour with the Anaheim Ducks. He’s scored five goals on 48 5v5 shots (10.4 percent)—half his production in Los Angeles in just over 25 percent of the shots. His shot rate has edged up slightly—to 8.5 S/60—but still very much in line with his time in Edmonton and Los Angeles. Of his five goals, four of them have been scored off of non-clean shots—three involved a goaltender in transition and one was from a rebound. That suggests that he’s involved in more of these shots again.
His production looks an awful lot like that of the Dustin Penner who played in Edmonton, only at half the salary. That’s a great deal for Anaheim.