
Joe Thornton is likely not going to be captain of the San Jose Sharks when the puck drops on the 2014-15 NHL season. Many argue that Thornton being stripped of the “C” is based on more than just last season and San Jose’s epic series loss to L.A. in the playoffs. He also carries the heavy burden of being known as a playoff “choker.” A load that increases with every season, solely due to his continued inability to hoist the Stanley Cup in what is most certainly a Hall of Fame career.
Unfortunately for Thornton, the pernicious idea that individual skaters are responsible for team results in the long term abounds, particularly when people fixate on the brief annual tournament that is the Stanley Cup playoffs. But the criticisms leveled at Thornton work as as a jumping off point for a larger discussion about small sample sizes.
No NHLer has ever actually exceeded 26 games in a single playoffs, and yet heroes and villains are made on the basis of this tiny slice of their careers, when variation is substantial. Thornton has played 16 NHL seasons covering 1,207 regular season games and 23,271 minutes of ice time. His playoff career spans just 132 games and 2,740 minutes of ice time, or 11.7 percent of his regular-season totals.
The Poisson distribution says that if you know the average rate at which a player produces points, you can determine his probable points over a given interval of time. But there’s a key underlying assumption: the mix of events that lead to scoring outcomes are random and periods of observation have no impact on one another. In many ways, the playoffs are actually best set up to explore this idea, because the time between observations is large enough that the assumption of independence is easily validated.
Thornton’s career regular-season P/G is 0.99. Using this as his average rate of production and the Poisson distribution, we can estimate his probability of producing his observed point totals for each of his playoff years. For the sake of simplicity, assume a result with a probability above 10 percent is in the “likely” range, while anything under five percent is relatively “unlikely.”
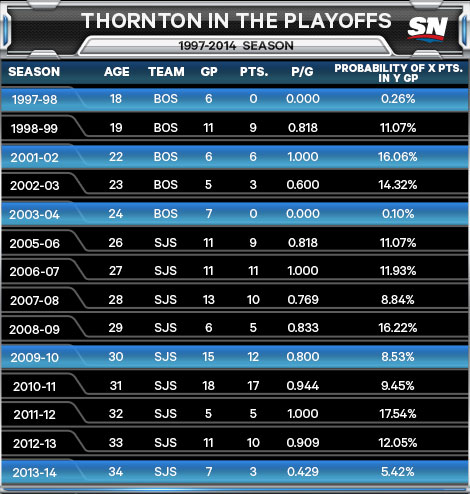
The highlighted seasons in the table all involve an extenuating circumstance of one form or another:
- He was a rookie in ’97-98
- An injured shoulder in ’01-02 that kept him out of game action for games 62–77. He must have had time to heal, though, as he posted a point per game in the playoffs
- An undisclosed “upper-body” injury forced him out of games 81 and 82 to close out the season, but he played through it in the playoffs, posting no points.
- A leg injury kept him out of games 76–78. Again, it’s possible he felt some ill effects, but producing 0.8 P/G on a bad leg is still pretty solid.
That list accounts for three of his four least likely point-production outcomes. Which leaves the hockey world, and Sharks management in particular, looking for answers when it comes to the 2014 post-season.
When we delve into more detailed analytics to describe player performance, it’s clear that much of what happens on the ice is determined by context—how a player is used and what happens around him while he is on the ice. Looking at the chart below it’s obvious what happened to Thornton’s playoff point production in 2014.
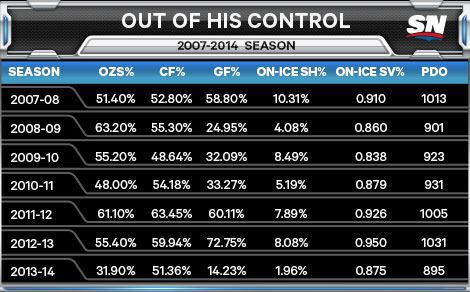
Just to be clear, the combination of a 1.96 percent percent On-Ice SH% and 0.875 On-Ice SV% is about as brutal as things get. Include the fact that Thornton was taking draws in the offensive zone only 31.9 percent of the time and it shouldn’t amaze anyone that he and his linemates were firing 51.36 percent of the shot attempts taken while they were on the ice.
Far from a failure of leadership, Thornton’s 2014 playoffs are a prime example of what horrible shooting and goaltending luck will do to a player in small samples when the odds are stacked against him in the first place. Remember that Thornton himself scored on 12.5 percent of his shots in the post-season—though only one goal came at even strength. Brent Burns shot 6.1 percent on 33 shots, Dan Boyle didn’t score on 17 shots, etc.
Thinking league wide, look at some of the players considered “clutch” in recent history: Daniel Briere, Justin Williams, Patrick Kane, Martin Gelinas, etc.—guys who came through when it really mattered. The reality is most produce at a comparable level to their regular-season numbers once you give them enough playoff games to do so. Let’s take a look at a graph and think about what it means.
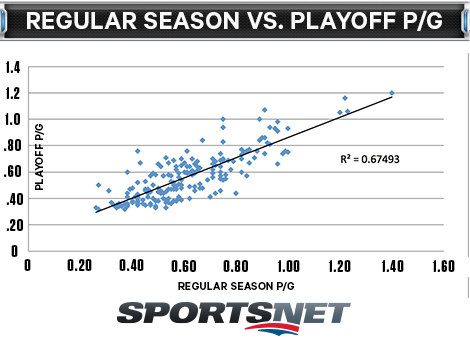
This graph displays active player point-production on a per-game basis in the regular season versus the post-season since 1995. The cutoff is 60 games in the playoffs and 200 in the regular-season. You’ll notice that the R2 value is 0.6749. In other words, 67 percent of what you observe in playoff scoring is described by what you see in the regular season, the other 33 percent is unexplained or random noise.
So Thornton is perceived as a playoff failure. But his production drop-off in the post-season—while not good—is less than that of Pavel Datsyuk and Teemu Selanne (despite their Stanley Cup wins). The list below highlights a number of Stanley Cup winners who have had significant point-production decreases in the playoffs.
![THORNTON4[1]](http://assets1.sportsnet.ca/wp-content/uploads/2014/09/THORNTON411.jpg)
The reality is that players suffer from runs of good and/or bad fortune in the playoffs. Evaluating any player on the basis of a single playoff run of seven games is bad management practice, and it leads to poor decision making. Joe Thornton wasn’t the problem for the Sharks in the playoffs in 2014. The reality is bad luck had a lot more to do with their early exit, but that isn’t something fans or management really want to hear.