After ranking the top-20 centres and top 20 left wingers in the NHL over the past three seasons, we’re moving on to ranking the total impact of right wingers relative to their peers today. Before we get into it, you can check out 2016’s list here, and 2017’s list here.
Like the past two years, I owe a lot of thanks for this project to others in the hockey analytics field, such as Emmanuel Perry, Dom Luszczyszyn, Steve Burtch, Dominic Galamini Jr., and Tyler Dellow. Their help along the way directly and indirectly influenced this project.
Statistics for this project were collected from SPORTLOGiQ, Natural Stat Trick, Corsica, Puck IQ, Hockey Reference, the NHL’s official website, and Dom Luszczyszyn’s Game Score database.
This year, in order to get a larger sample size to work with, I lowered the barrier of eligibility for the rankings from 2000 5-on-5 minutes over three seasons to 2000 minutes overall. This helped to include some promising young players, but there are still rookies from last year who won’t make the cut — 96 right wingers qualified for the project.
[relatedlinks]
The weighting of the categories for right wingers remains the same as last season; 60 for offence, 25 for transition, and 15 for defence. New statistics have been added, and the difficulty of minutes adjustment has been changed. Previously, players could be awarded a maximum of a 25 per cent boost to their score based on the difficulty of their minutes, while this year that was changed to 30 per cent — the mean score for each position was taken and deducted from each individual’s difficulty score, so a player’s score could be boosted or knocked down depending on the difficulty of the minutes they were assigned. The difficulty adjustment is already applied to the numbers shown and on the graphics.
Each season was weighted so that recent years account for more of a player’s total score, with 22.2 per cent for 2015-16, 33.3 per cent for 2016-17, and 44.5 per cent from 2017-18. If a player only played in two of those seasons the weighting was changed to 42.8 per cent for 2016-17, and 57.8 per cent for 2017-18.
Here are the statistics used in each category:
Offence: 5-on-5 and power play goals, primary assists, secondary assists, high danger scoring chances, scoring chances, passes to the slot, scoring chances off the rush, passes off the rush, rebound recoveries, scoring chance generating plays, shot attempts, penalties drawn, on-ice goals for relative to teammates (all per 60 minutes), and offensive zone pass completion rate.
Transition: 5-on-5 outlet passes, stretch passes, controlled carries out of the defensive zone, neutral zone passes forward and east-west, controlled entries into the offensive zone (all per 60 minutes), Corsi for percentage, Corsi for percentage relative to teammates, controlled exit rate relative to teammates, controlled entry rate relative to teammates, outlet, stretch, and neutral zone pass completion rates relative to teammates.
Defence: 5-on-5 and shorthanded loose puck recoveries by zone, blocked passes, stick checks, body checks, blocked shots, puck battles won, penalties taken, on-ice goals against relative to teammates, on-ice shot attempts against relative to teammates, on-ice passes to the slot against relative to teammates, on-ice high danger chances against relative to teammates (all per 60 minutes), turnover rate by zone relative to teammates.
Degree of difficulty: Puck IQ’s competition faced percentages (2016-17 only), Game Score’s quality of forwards faced, Game Score’s quality of defencemen faced, Game Score’s quality of teammate forwards, Game Score’s quality of teammate defencemen, Corsi quality of competition, Corsi quality of teammates, time on ice quality of competition, time on ice quality of teammates, personal shooting percentage relative to career average, on-ice shooting percentage, on-ice save percentage, defensive zone starts percentage, 5-on-5 ice time, and overall ice time per game.
There’s a slight change to the charts this year as well. I’ll be showing how players rank both in percentile form, a straight up “what percentage of their peers are they ahead of” and also the percentage that the player impacts a category compared to the best player at their position, which I’m calling per cent of peak. For example Tyler Johnson’s transition impact is 65.4 per cent of Patrick Kane’s.
Let’s get into it.
20. Cam Atkinson
Difficulty adjustment: +2.47%
Offence: 34.78/60 | Transition: 12.53/25 | Defence: 6.72/15
Total: 54.03/100
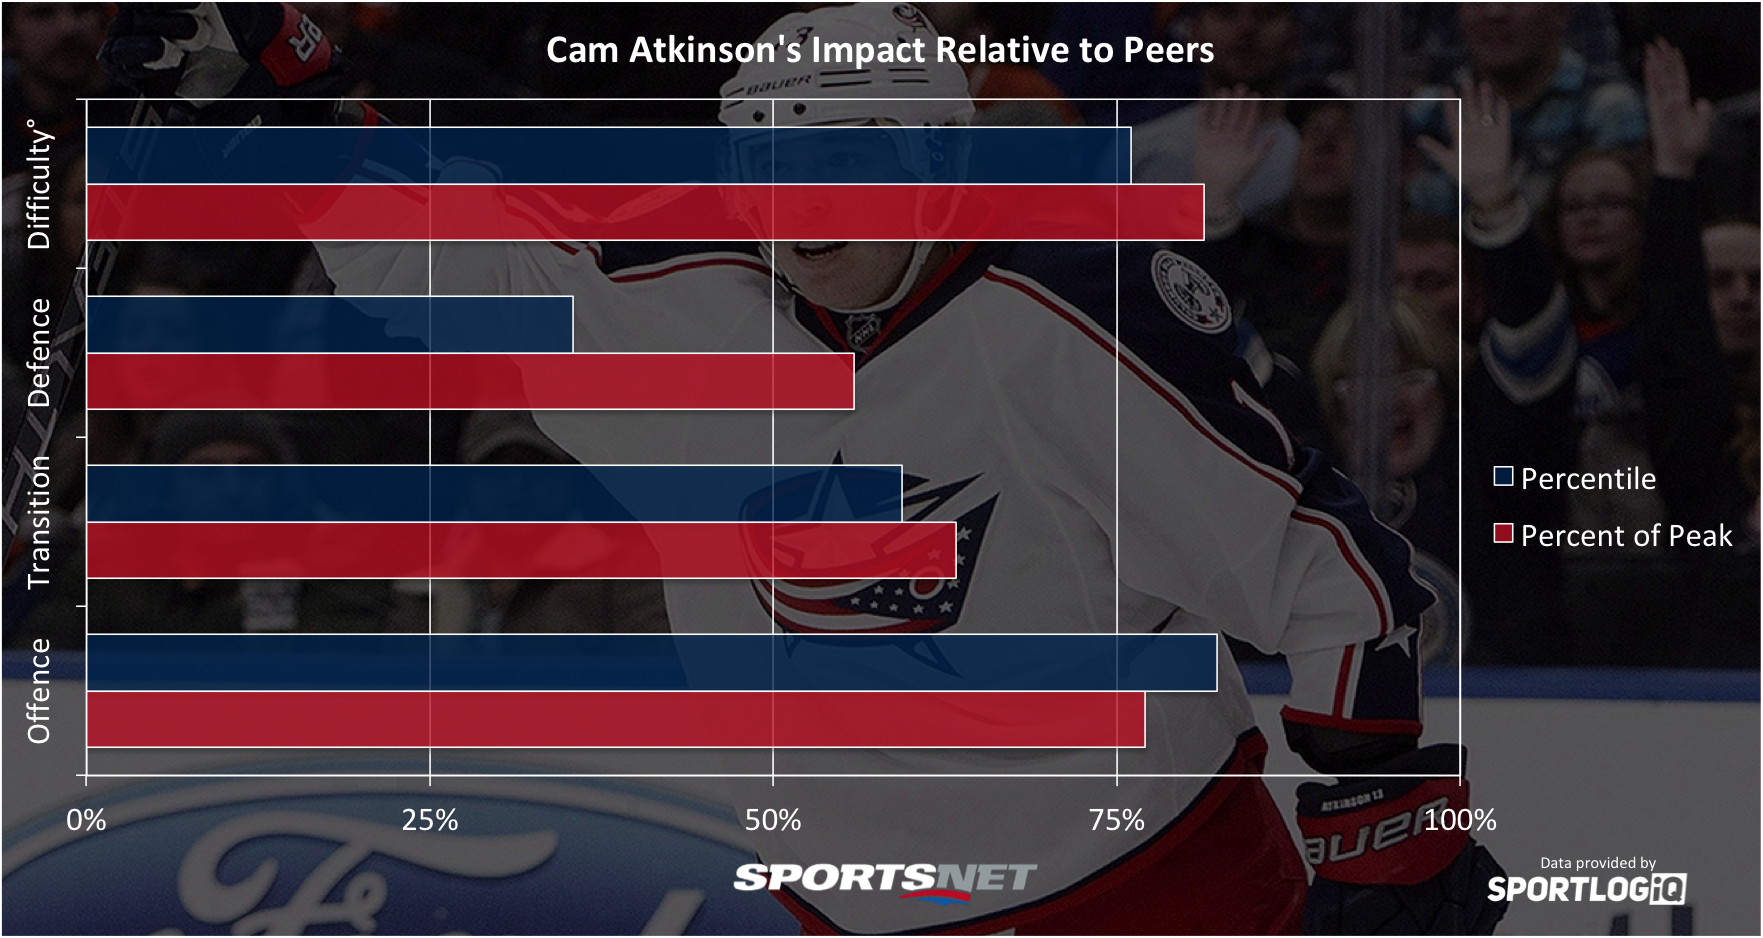
For the first time in four seasons Atkinson missed significant time, but that didn’t stop him from posting his fifth-straight 20-goal season. A consistent goal scoring threat due to his ability to get into the middle of the ice and shoot quickly, very few players put as many shots or scoring chances at the net as Atkinson.
In other areas of the game, Atkinson doesn’t stand out quite as much. He’s a little above average in transition, mostly due to his ability to gain the offensive zone with possession. Defensively, Atkinson is a bit of a liability due to high neutral zone turnover rates, and being a bit conservative in both challenging opponents with the puck, and winning loose pucks.
19. Sam Reinhart
Difficulty adjustment: +1.73%
Offence: 29.76/60 | Transition: 15.69/25 | Defence: 8.96/15
Total: 54.41/100
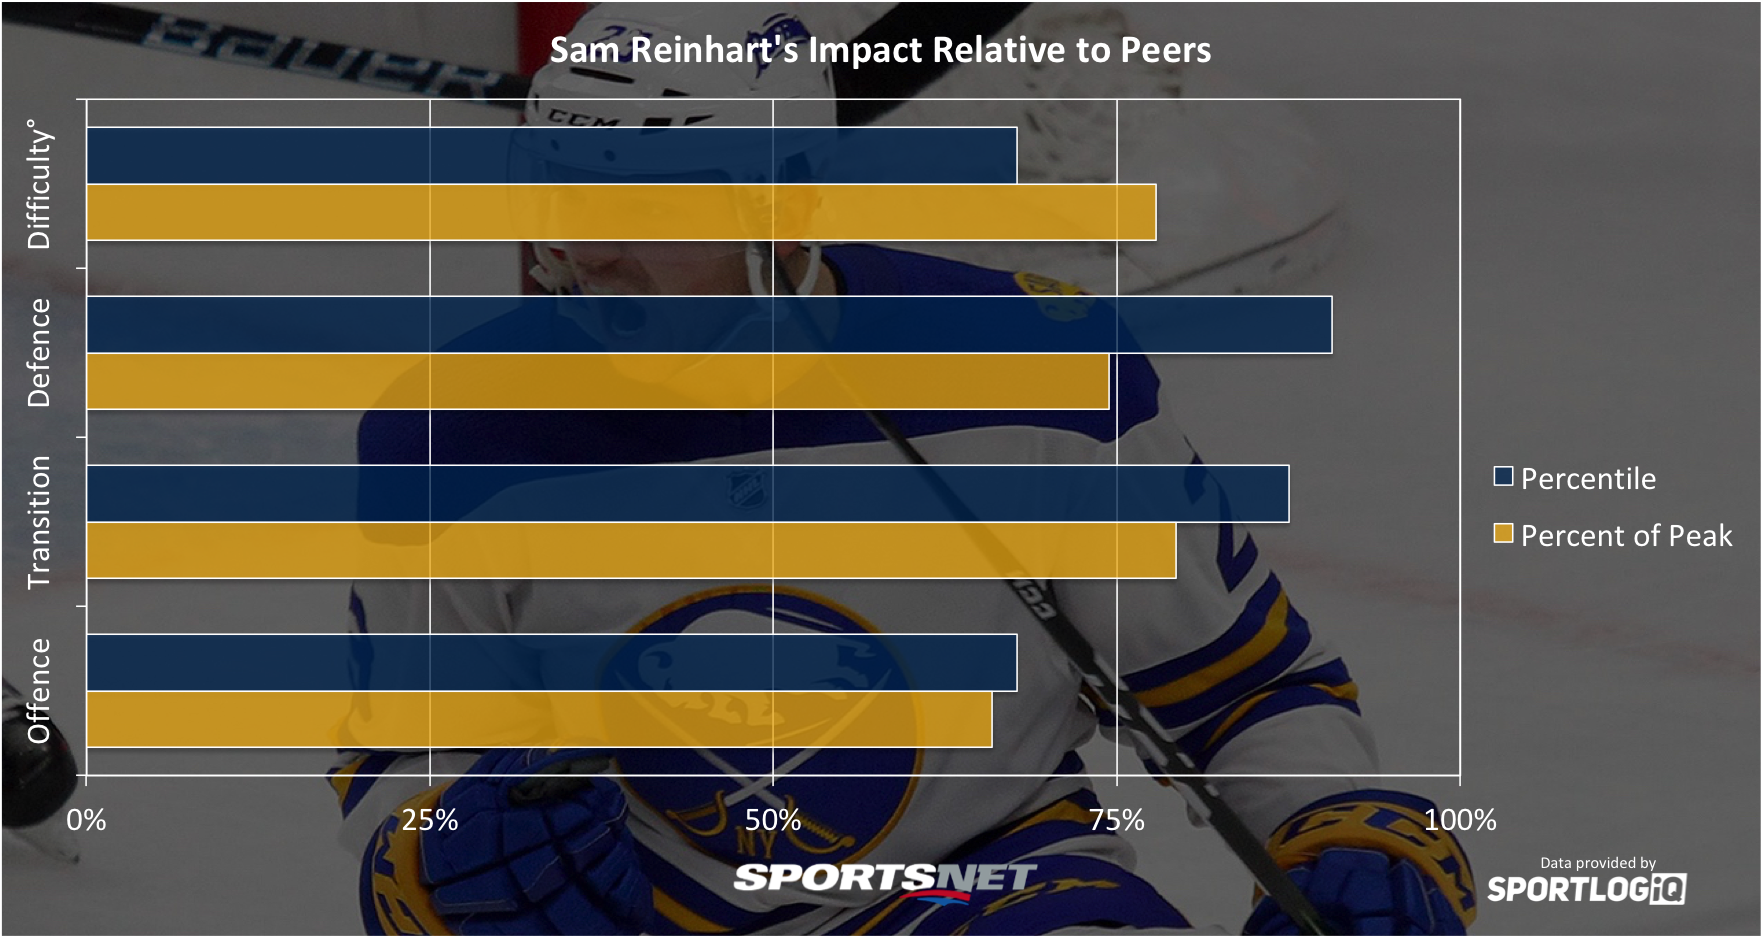
There have been a lot of doubters in Sam Reinhart’s short NHL Career, but he has made significant progress, especially without the puck. Reinhart has continually become a better puck handler over the past few years, cutting down his turnover rates in every zone, especially the neutral zone. Playing with Ryan O’Reilly certainly helped him defensively, but he’s made strides of his own, specifically with winning loose pucks.
In transition, Reinhart is a strong zone exit option for the Sabres — he is a bit more average once outside the defensive zone, but has no glaring weakness. At 5-on-5, Reinhart hasn’t been the offensive star the Sabres expected when they took him second overall in 2014, but on the power play he’s quite deadly and one of the better shooters on the Sabres. The potential of playing with Jack Eichel and Jeff Skinner all season could create a breakout situation for Reinhart if he can finally contribute at even strength like he does on the power play.
18. Craig Smith
Difficulty adjustment: +0.09%
Offence: 32.33/60 | Transition: 14.44/25 | Defence: 7.83/15
Total: 54.60/100
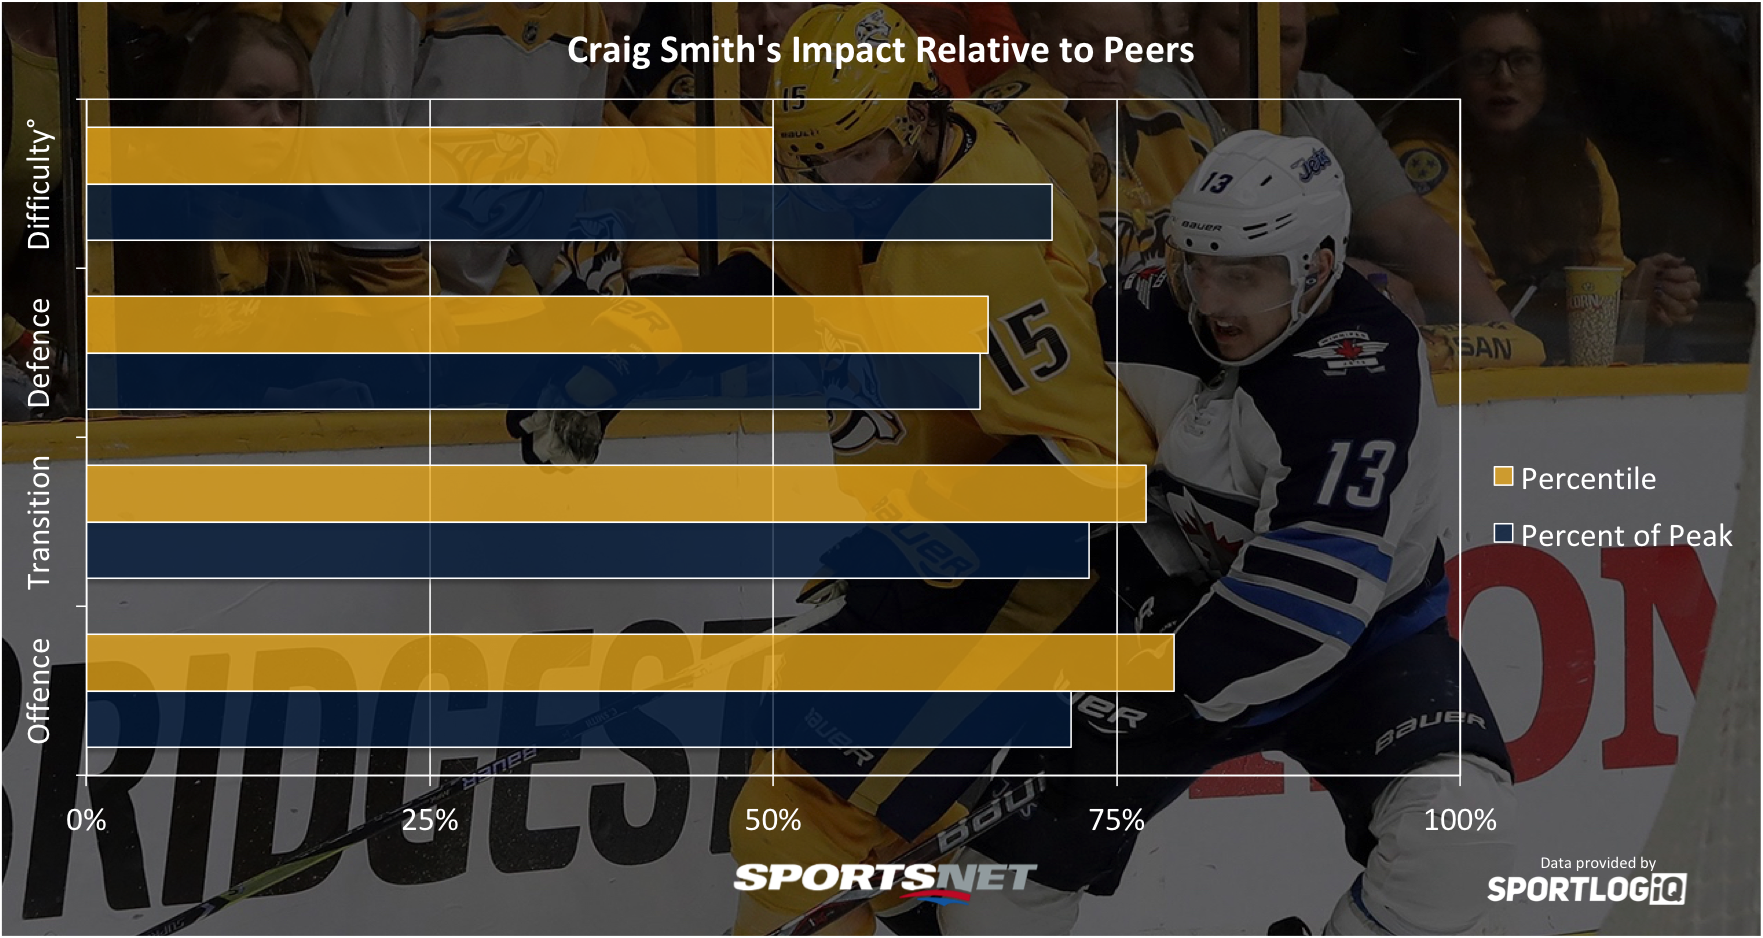
After two down years in a row, Craig Smith played tougher minutes in 2017-18 and managed the best season of his career. Smith isn’t a flashy player, but he’s crafty at getting to the dangerous areas and that makes him an ideal plug and play winger without any glaring weaknesses in his game.
Aside from high shot and scoring chance rates, one thing that helps Smith continually post solid possession numbers is his low turnover rate in the offensive zone. Plays very rarely die on his stick, which leads to prolonged zone time and higher quality scoring chances.
[snippet ID=3322139]
17. Jakub Voracek
Difficulty adjustment: +3.46%
Offence: 31.39/60 | Transition: 15.82/25 | Defence: 7.57/15
Total: 54.77/100
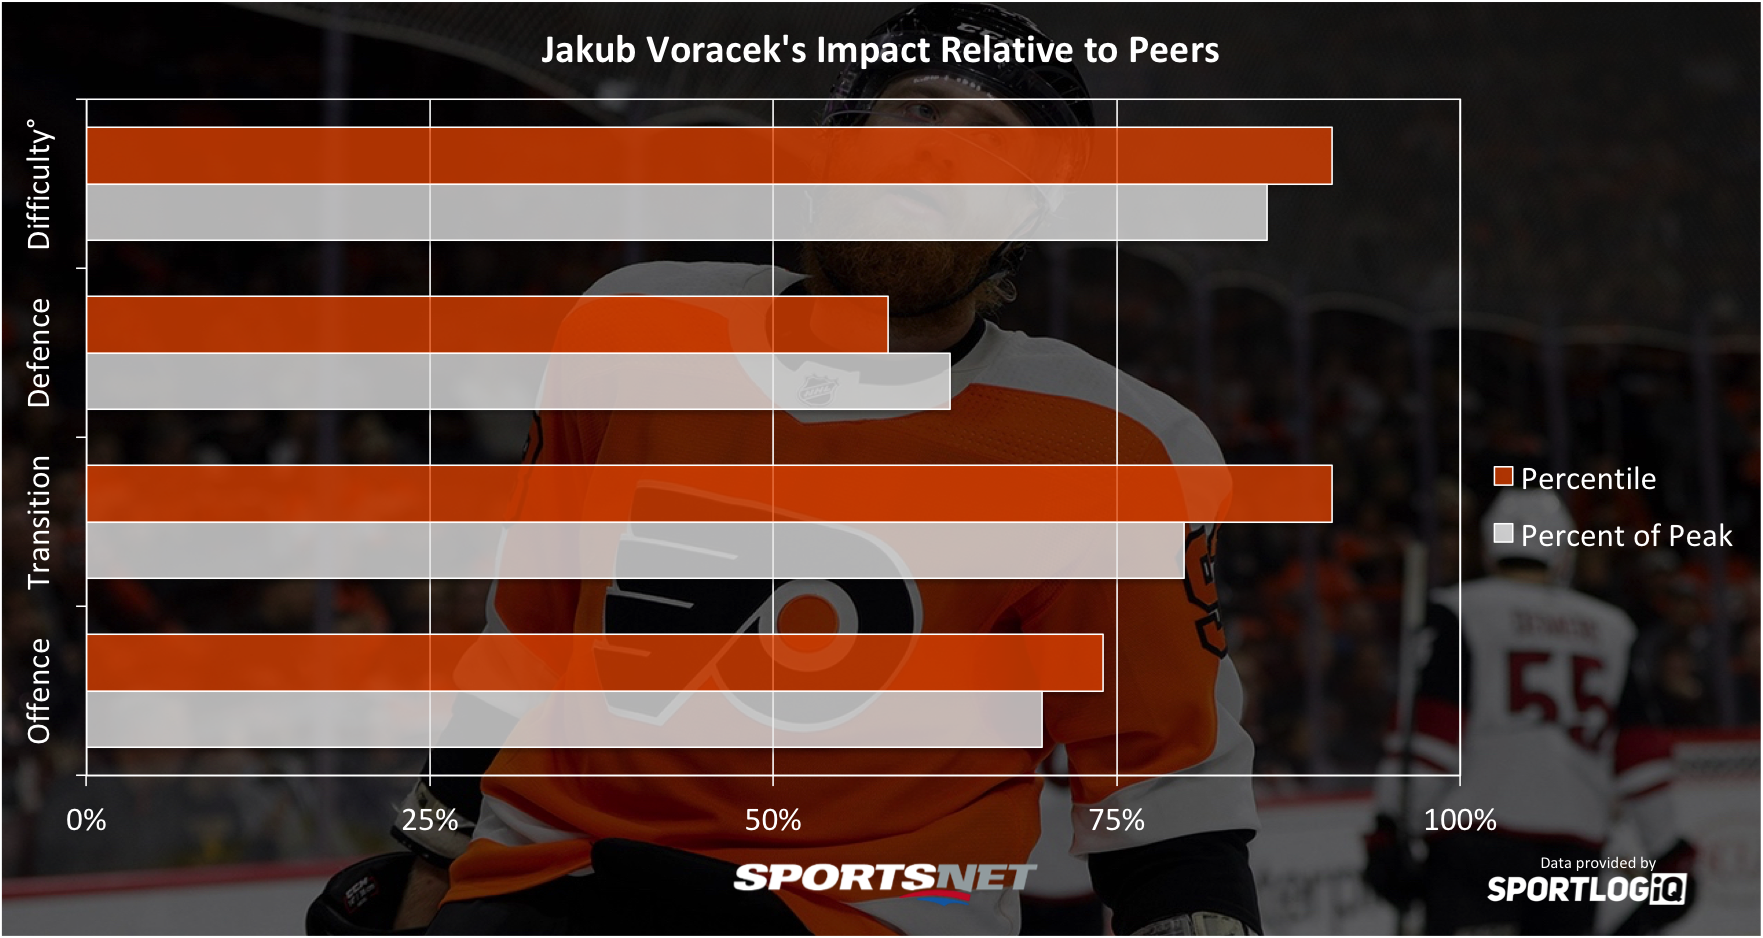
The way the stats are weighted for wingers in this project favours goal scorers over playmakers, which makes it all the more impressive that Jake Voracek continually cracks the top 20. Voracek is one of the premier playmaking wingers in the NHL, dangerous both at 5-on-5 and on the power play. The Flyers score far more often when he’s on the ice in every situation.
What’s surprising to me is that despite Voracek’s passing skills, his transition dominance comes more through carrying the puck than passing it. His ability to beat players one-on-one and pick lanes through the neutral zone is what stands out. Perhaps it’s because opponents need to be careful of covering passing lanes that he is able to pick his way through checks and move up the ice.
16. Jordan Eberle
Difficulty adjustment: +2.68%
Offence: 32.27/60 | Transition: 14.96/25 | Defence: 7.99/15
Total: 55.22/100
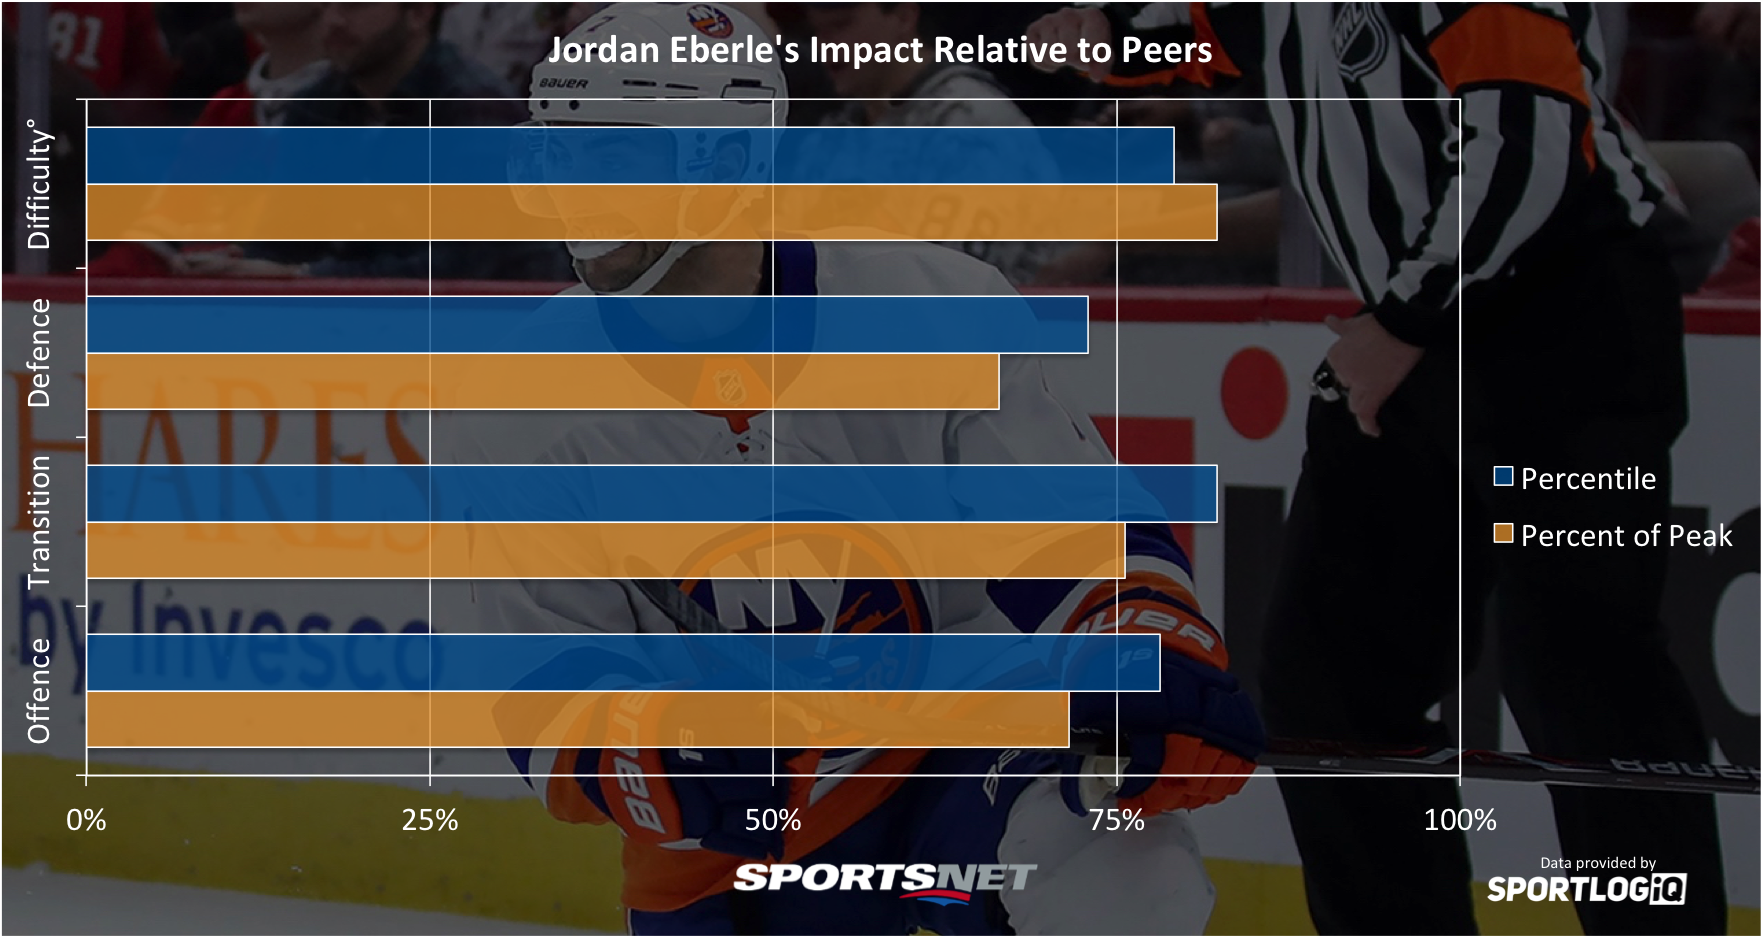
A fifth-straight 20-goal year capped off a strong first season on Long Island and Eberle proved his critics wrong. Eberle has a reputation for being one-dimensional, but he’s actually pretty well-rounded — most of his career has been spent playing in tough situations with poor quality teammates.
In the neutral and offensive zones, Eberle has some of the lowest relative turnover rates of any right winger. He combines that with strong stickhandling skills to get through the neutral zone and beat players in the offensive zone to create higher quality chances for both himself and teammates.
15. Mikael Granlund
Difficulty adjustment: +2.22%
Offence: 34.90/60 | Transition: 13.92/25 | Defence: 7.94/15
Total: 56.77/100
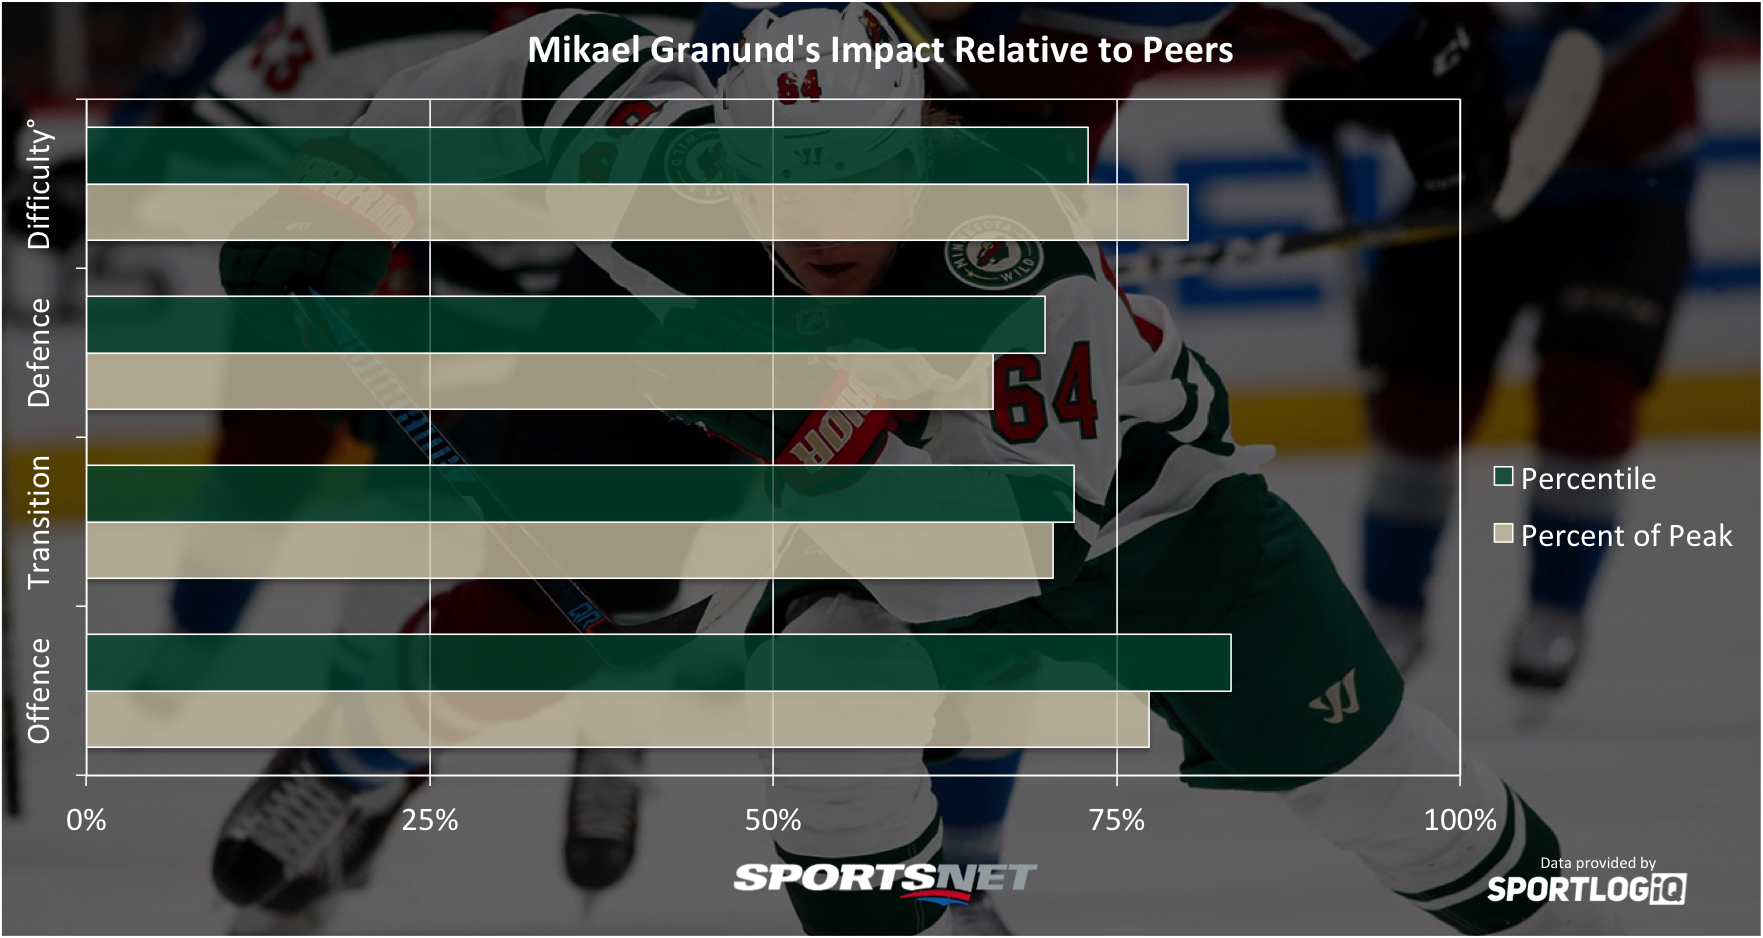
The last two seasons have completely changed the course of Mikael Granlund’s career, starting with an offensive breakout in 2016-17 and taking massive strides in his defensive game last season. Granlund isn’t a huge shooter, but he’s a well-balanced offensive threat who can pick corners or make passes through traffic. He leans more on playmaking at even strength and on shooting when on the power play.
Defensively, Granlund stands out for having the lowest defensive zone turnover rate relative to his teammates of any right winger in the NHL. He’s surprisingly strong at breaking up centering passes in his own zone — something wingers rarely do — and doesn’t take many penalties.
14. Mikko Rantanen
Difficulty adjustment: +4.08%
Offence: 35.95/60 | Transition: 14.67/25 | Defence: 6.65/15
Total: 57.27/100
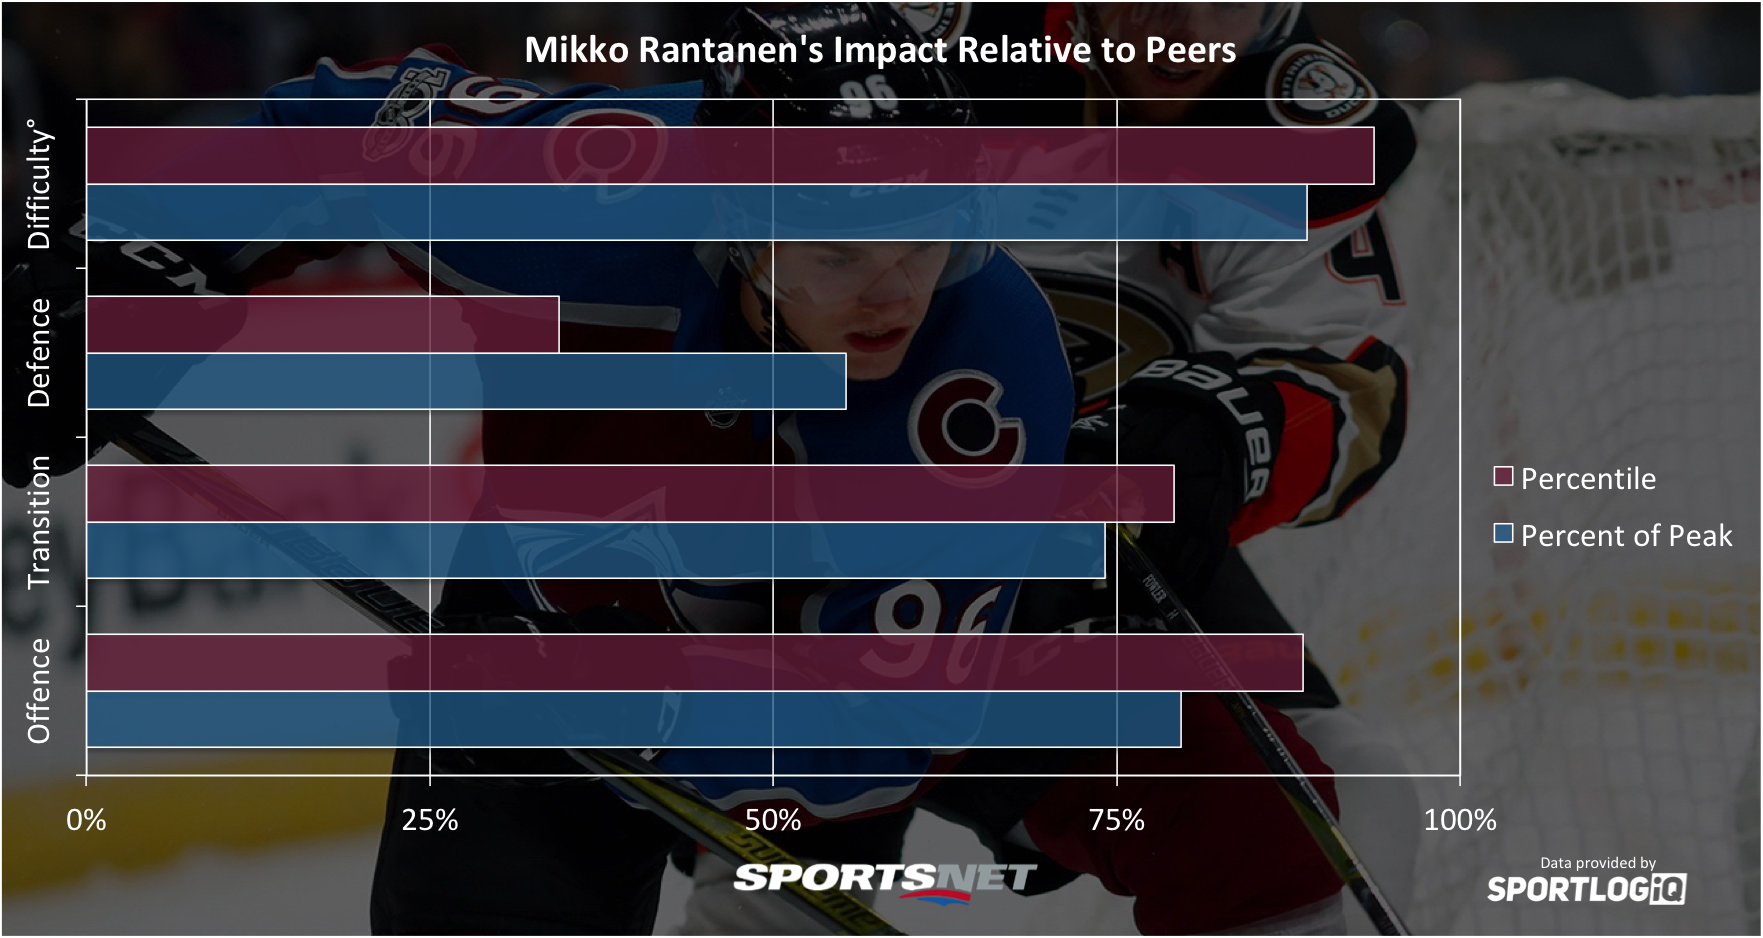
Playing with Nathan MacKinnon has its perks, but we shouldn’t ignore how much of an impact Mikko Rantanen’s emergence played in MacKinnon’s MVP-worthy season. At even strength, Rantanen plays more of a playmaking role and absolutely depends on MacKinnon to create plays, but on the power play Rantanen is a dangerous goal scorer and far more involved.
In transition, Rantanen has laser focus with passes and rarely misses his intended target. He’s particularly excellent at gaining the offensive zone with possession which, combined with MacKinnon’s talent, gives Colorado’s top line two of the NHL’s most dangerous attackers off the rush.
13. Nino Niederreiter
Difficulty adjustment: +0.47%
Offence: 32.07/60 | Transition: 15.74/25 | Defence: 9.50/15
Total: 57.31/100
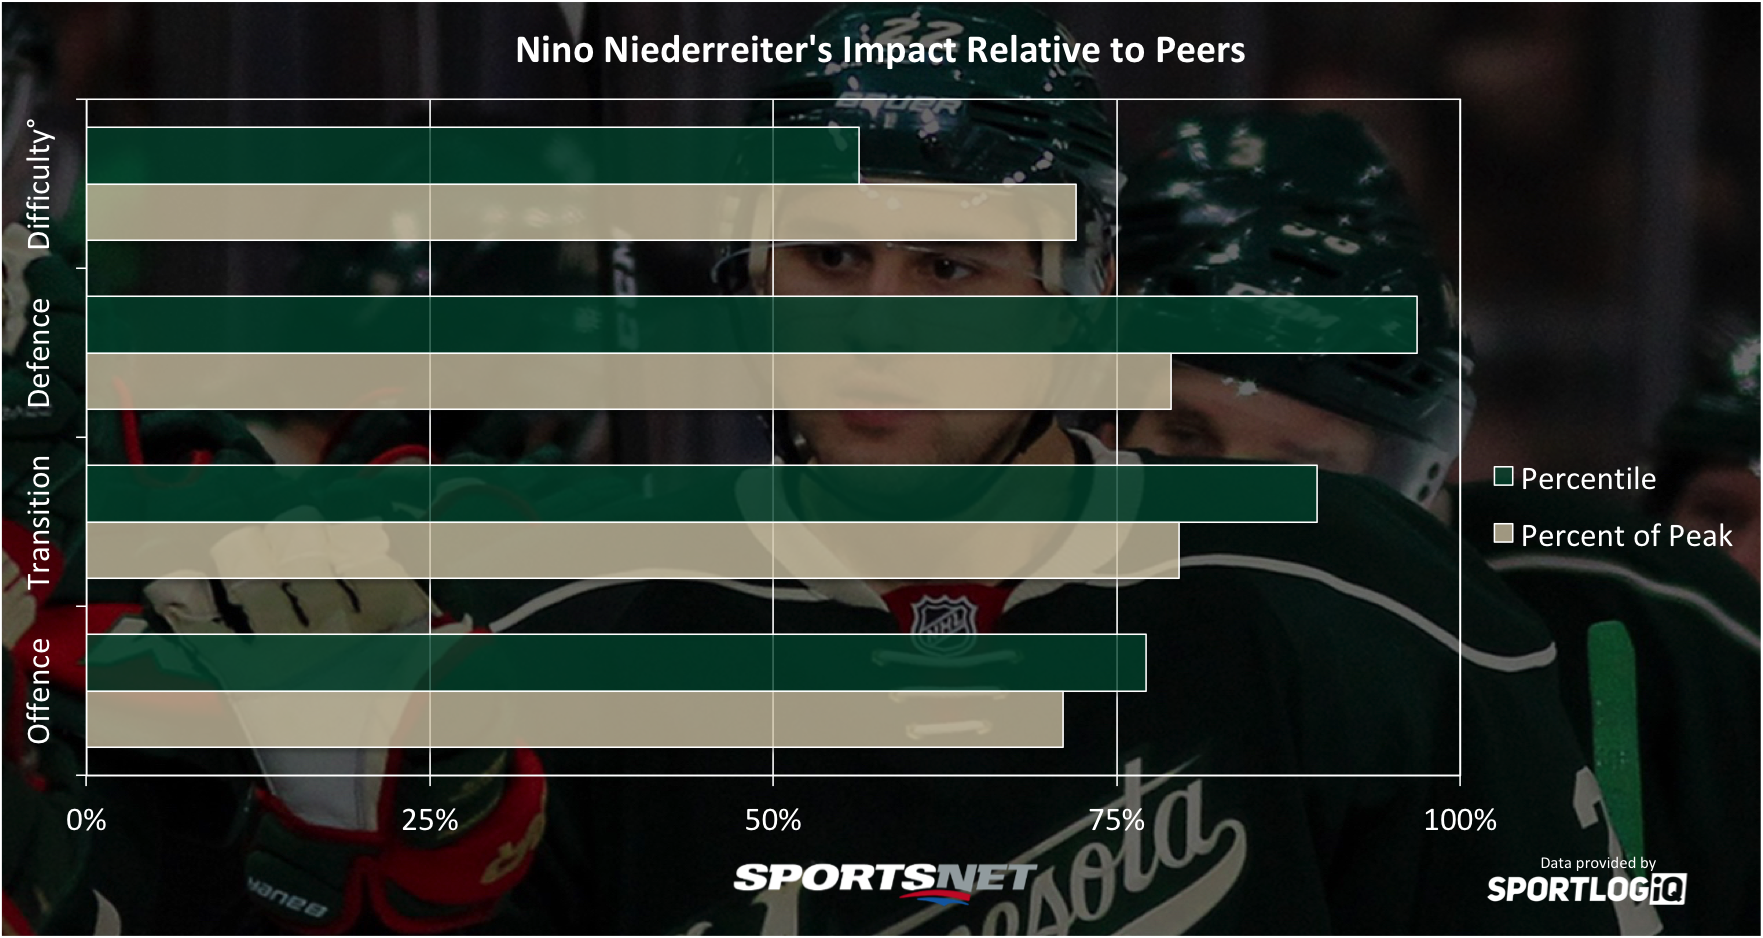
Niederreiter drops seven spots after a rough offensive season, but his strength defensively and in transition keeps him up there with the best players at his position. Niederreiter was particularly strong last season in his puck management, boasting extremely low turnover rates in every zone and leading Minnesota to facing far fewer counterattack chances while he was on the ice.
He was also a precision passer in every zone, setting up breakouts, zone entries, and shots, leading to fantastic shot differentials. While he was a strong power play shooter, Niederreiter’s scoring chance generation at even strength and the power play plummeted last season, so it remains to be seen what kind of offence he can produce on a consistent basis.
12. Alexander Radulov
Difficulty adjustment: +2.85%
Offence: 35.80/60 | Transition: 14.62/25 | Defence: 7.43/15
Total: 57.86/100
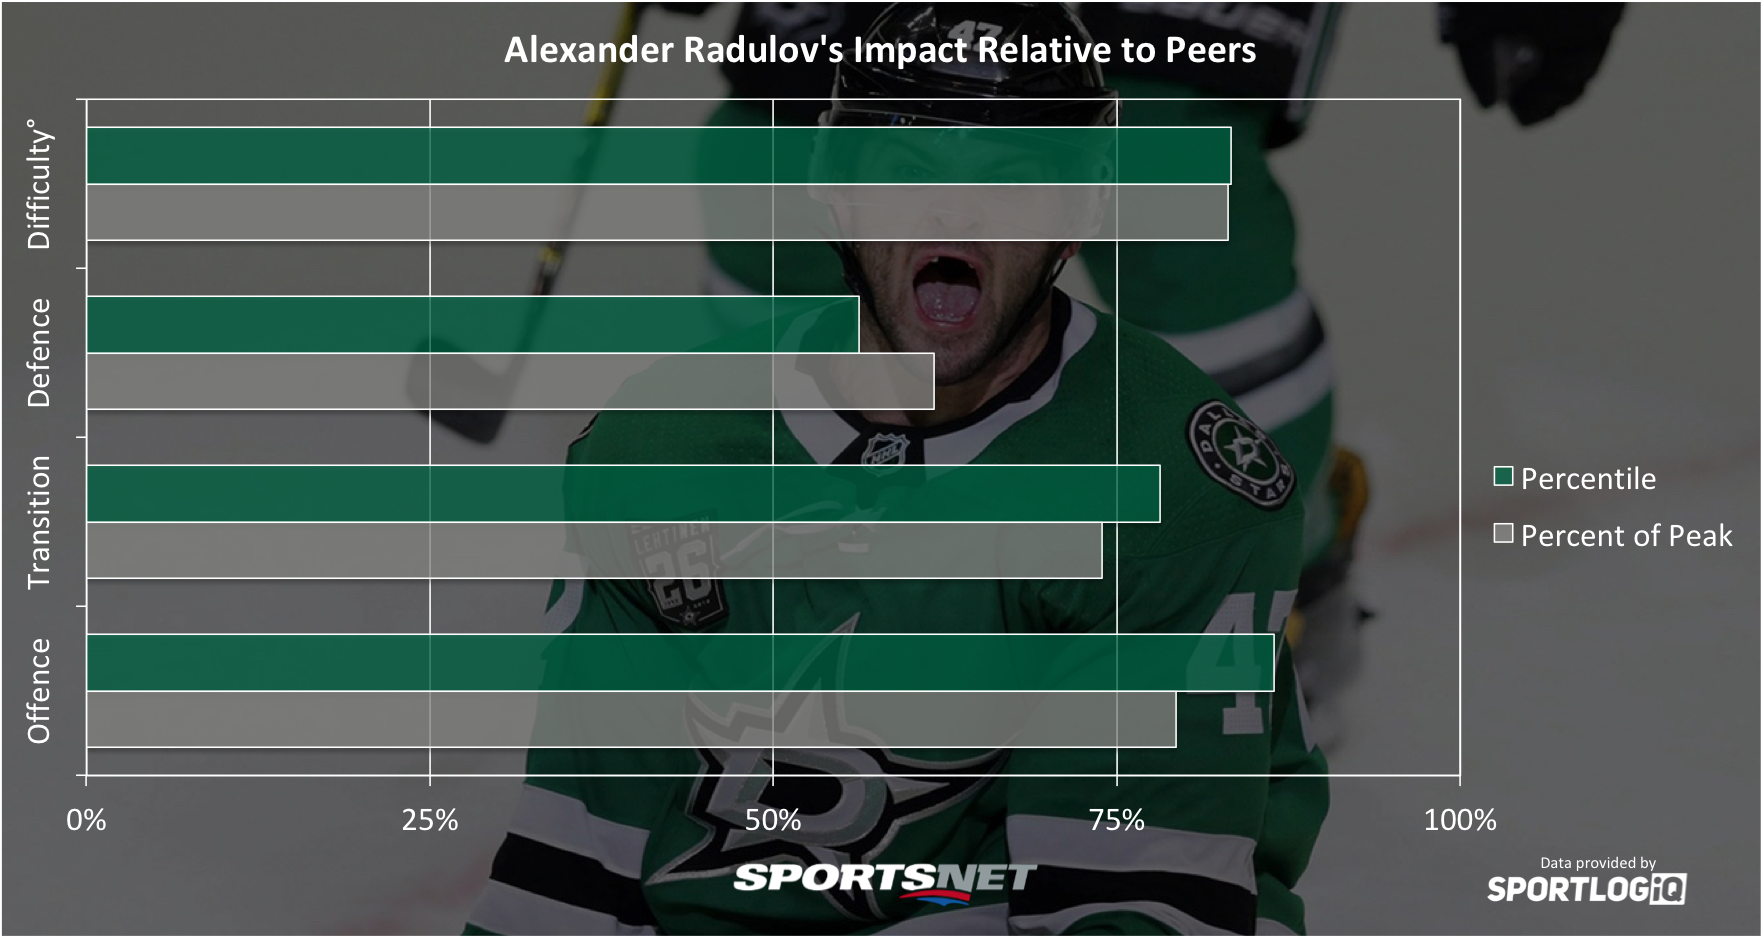
Radulov found himself in a near-perfect situation when he signed in Dallas, slotting on the top line with Tyler Seguin and Jamie Benn. As you might expect, he posted career highs in goals (27) and assists (45). Playmaking is usually Radulov’s bread and butter, but his relentlessness around the puck leads to a lot of second chance opportunities.
Radulov’s transition game is built on his playmaking, as he has the highest pass success rate relative to teammates of any right winger over the past three seasons. He does, however, turn the puck over in the neutral zone a fair amount trying to carry it through opposing defensive schemes. While Radulov is a fairly active defender, he can get caught running around in his own zone a lot and as a result was on the ice for more passes to the slot against than any other right winger. Wingers aren’t as responsible for defending those plays as centres, but it is a weakness.
[snippet id=3816507]
11. Brendan Gallagher
Difficulty adjustment: +1.19%
Offence: 35.43/60 | Transition: 15.59/25 | Defence: 8.35/15
Total: 59.37/100
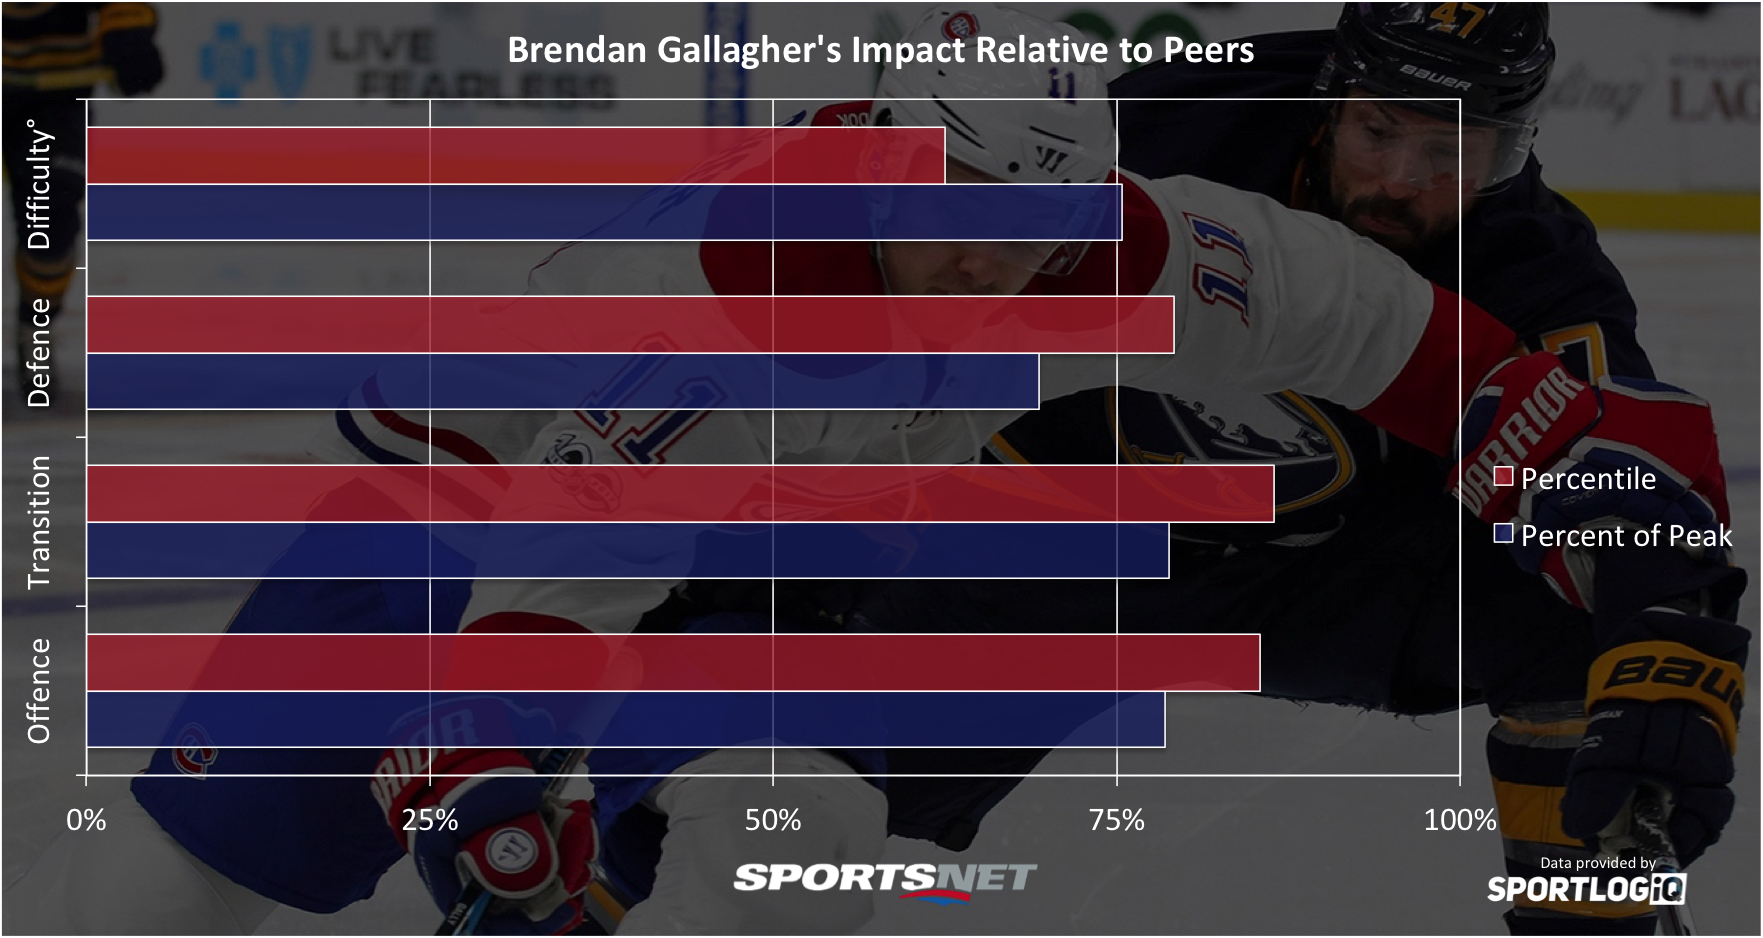
After a couple of seasons recovering from his hand being blown apart by slapshots off the sticks of Johnny Boychuk and Shea Weber, Gallagher returned with a vengeance in 2017-18, playing the entire season and posting career highs in goals and assists. He was easily the brightest spot in a dismal season for Montreal.
Throughout most of his career, Gallagher has generated his chances at the net front by battling for pucks or deflecting shots, but last season he started to diversify his game by attacking more off the rush and sinking back into the high slot to shoot more like a sniper. This gave him a bit more time to shoot and led to a huge boost in goals. Gallagher also leaned on his skating ability to carry the puck through the neutral zone more often, which made him an even more impactful and versatile player.
10. Patrik Laine
Difficulty adjustment: +0.82%
Offence: 41.06/60 | Transition: 12.79/25 | Defence: 5.82/15
Total: 59.66/100
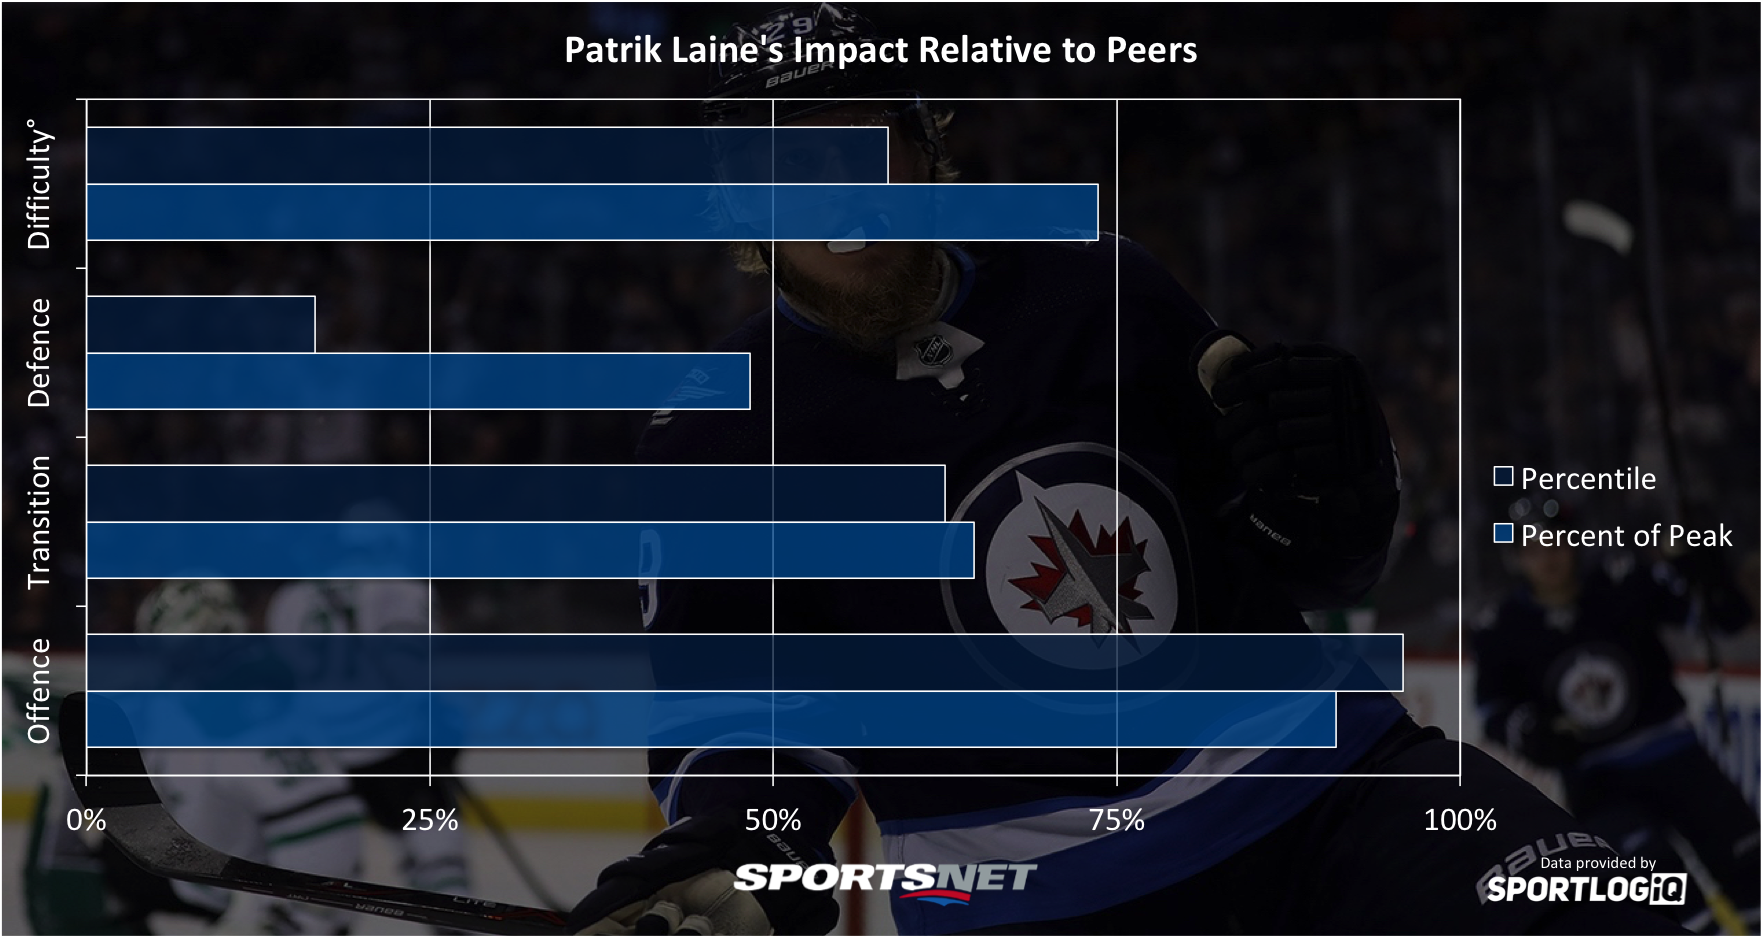
The Finnish goal scoring phenom was probably expected to be higher on this list, but what makes Laine so special can sometimes be missed by statistics because he’s so unique. If he isn’t already, he will soon be the NHL’s best sniper and similar to his predecessor in Alex Ovechkin, Laine’s game is a little one-dimensional. He doesn’t engage much without the puck, and is an average transition player.
But what makes him special? He’s a game changer. Laine can score from anywhere at absurdly high rates and I’m not sure anyone has ever had a shot like his. In fact, only two players have ever scored more than his 80 goals as a teenager in NHL history: fellow Jet Dale Hawerchuk with 85 and Jimmy Carson with 92. Both those players played in the highest scoring era in NHL history, which can’t be said for Laine. He is one of the few players, maybe the only one, who doesn’t need to get into the slot to score consistently. It makes him nearly impossible to stop.
9. William Nylander
Difficulty adjustment: +1.22%
Offence: 35.98/60 | Transition: 16.27/25 | Defence: 8.46/15
Total: 60.71/100
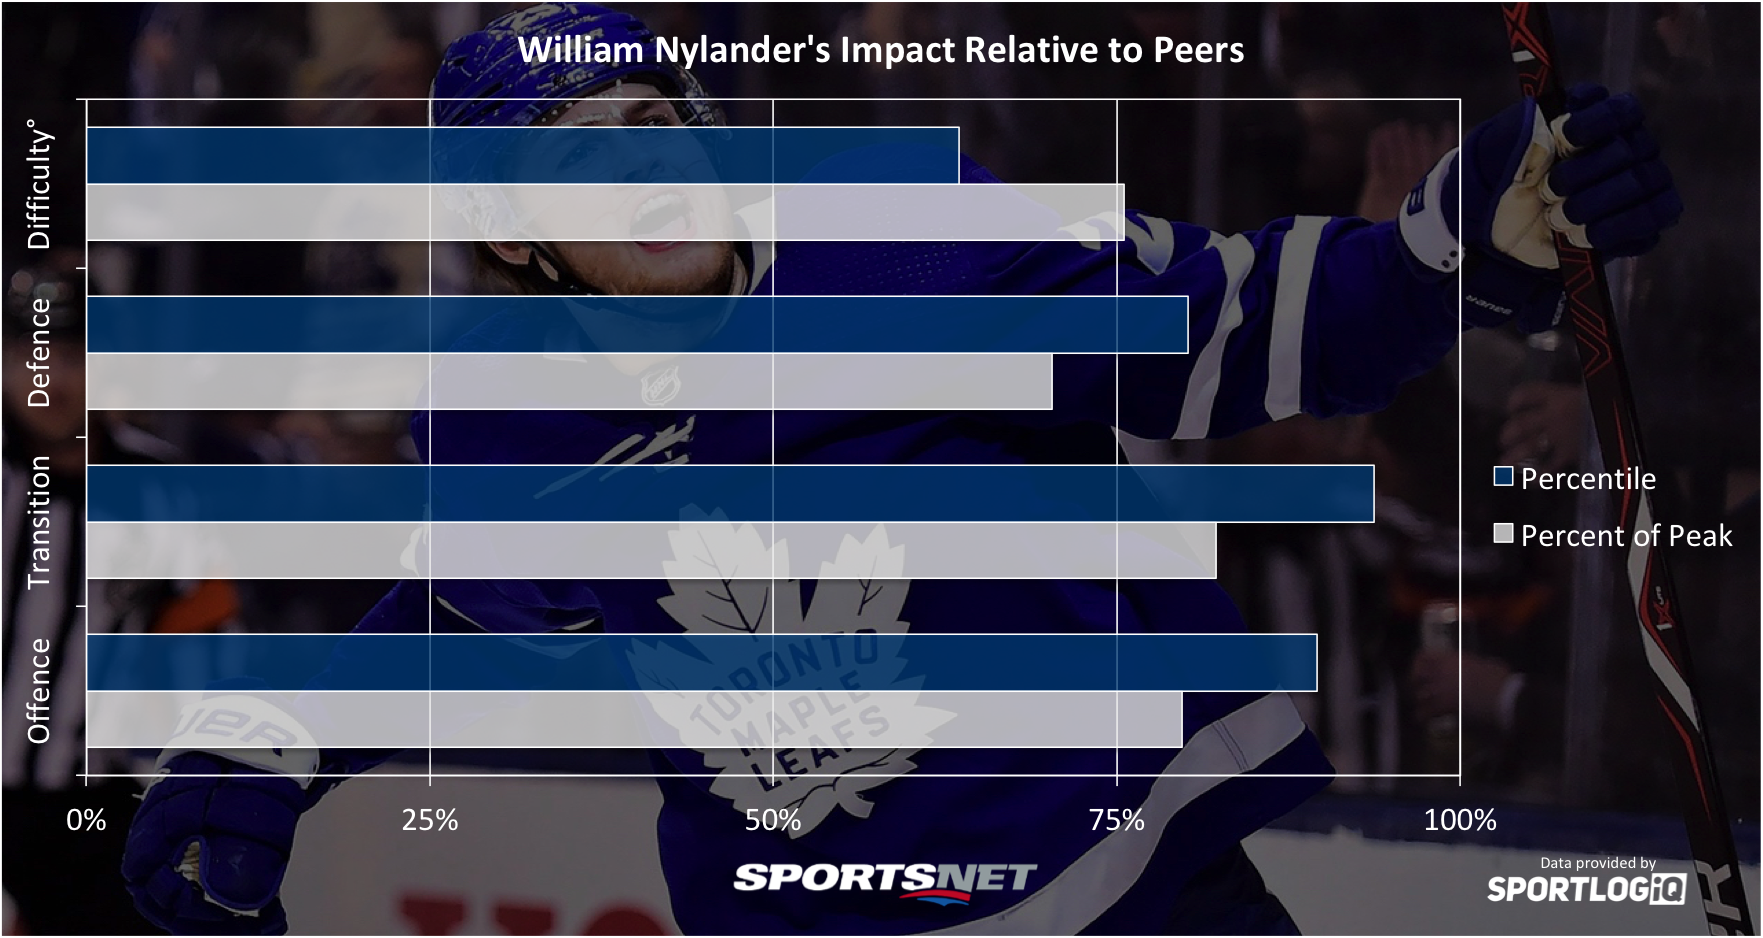
William Nylander debuts in the top 10 and would actually be even higher on the list if his 22-game tryout at the end of 2015-16 wasn’t counted. Nylander is one of the most gifted playmakers in the league at even strength, which pairs perfectly with Auston Matthews. But while Nylander hasn’t had good fortune on the power play so far in his career, he creates scoring chances with the man advantage at a top-15 rate for his position.
A superb transition player, Nylander is also a strong neutral zone defender who is smart with his stick and aggressive with his positioning to poke pucks loose and gather them up. But in the defensive zone he’s a little absent.
He can be a liability if opponents establish solid zone time, but because of his neutral zone play and lack of turnovers everywhere on the ice, that hasn’t been much of a problem in his career. Clearly he has his critics around the NHL, and there is something to be desired about his effort level in the defensive zone, but Nylander is already a special player.
8. Mitchell Marner
Difficulty adjustment: -0.14%
Offence: 39.37/60 | Transition: 14.39/25 | Defence: 8.97/15
Total: 62.73/100
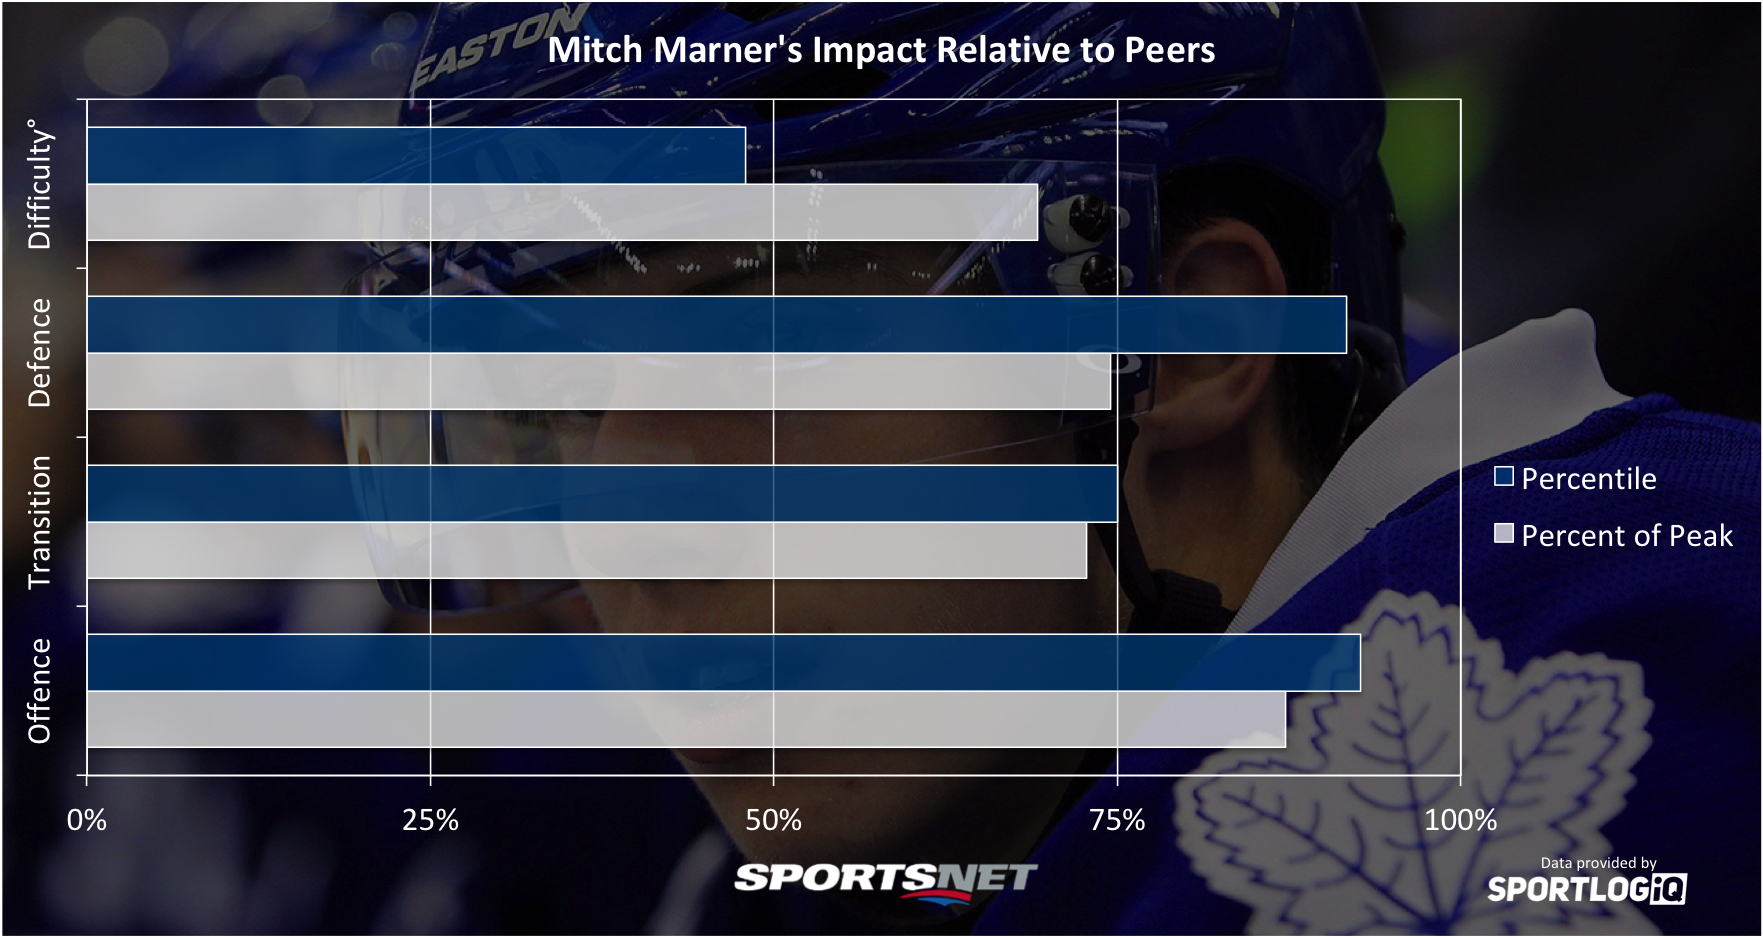
Flashy may as well be Marner’s middle name, but recently he’s been backing up the fancy play with hard work. His defensive play improved by almost 35 per cent from his rookie year, and most of that difference was made up in the second half. Marner has made massive strides without the puck, especially in the defensive zone where he camped out in passing lanes to pick off pucks and move the play forward.
Everyone already knows about the offensive side of his game. He’s a masterful puckhandler who can score and make plays happen, but his skills really come into focus on the power play. Marner was the engine behind the best five-man unit in recent history last year, and based on the pre-season, he’s right back on the same scoring pace.
7. Sebastian Aho
Difficulty adjustment: +4.00%
Offence: 39.51/60 | Transition: 14.79/25 | Defence: 8.50/15
Total: 62.79/100
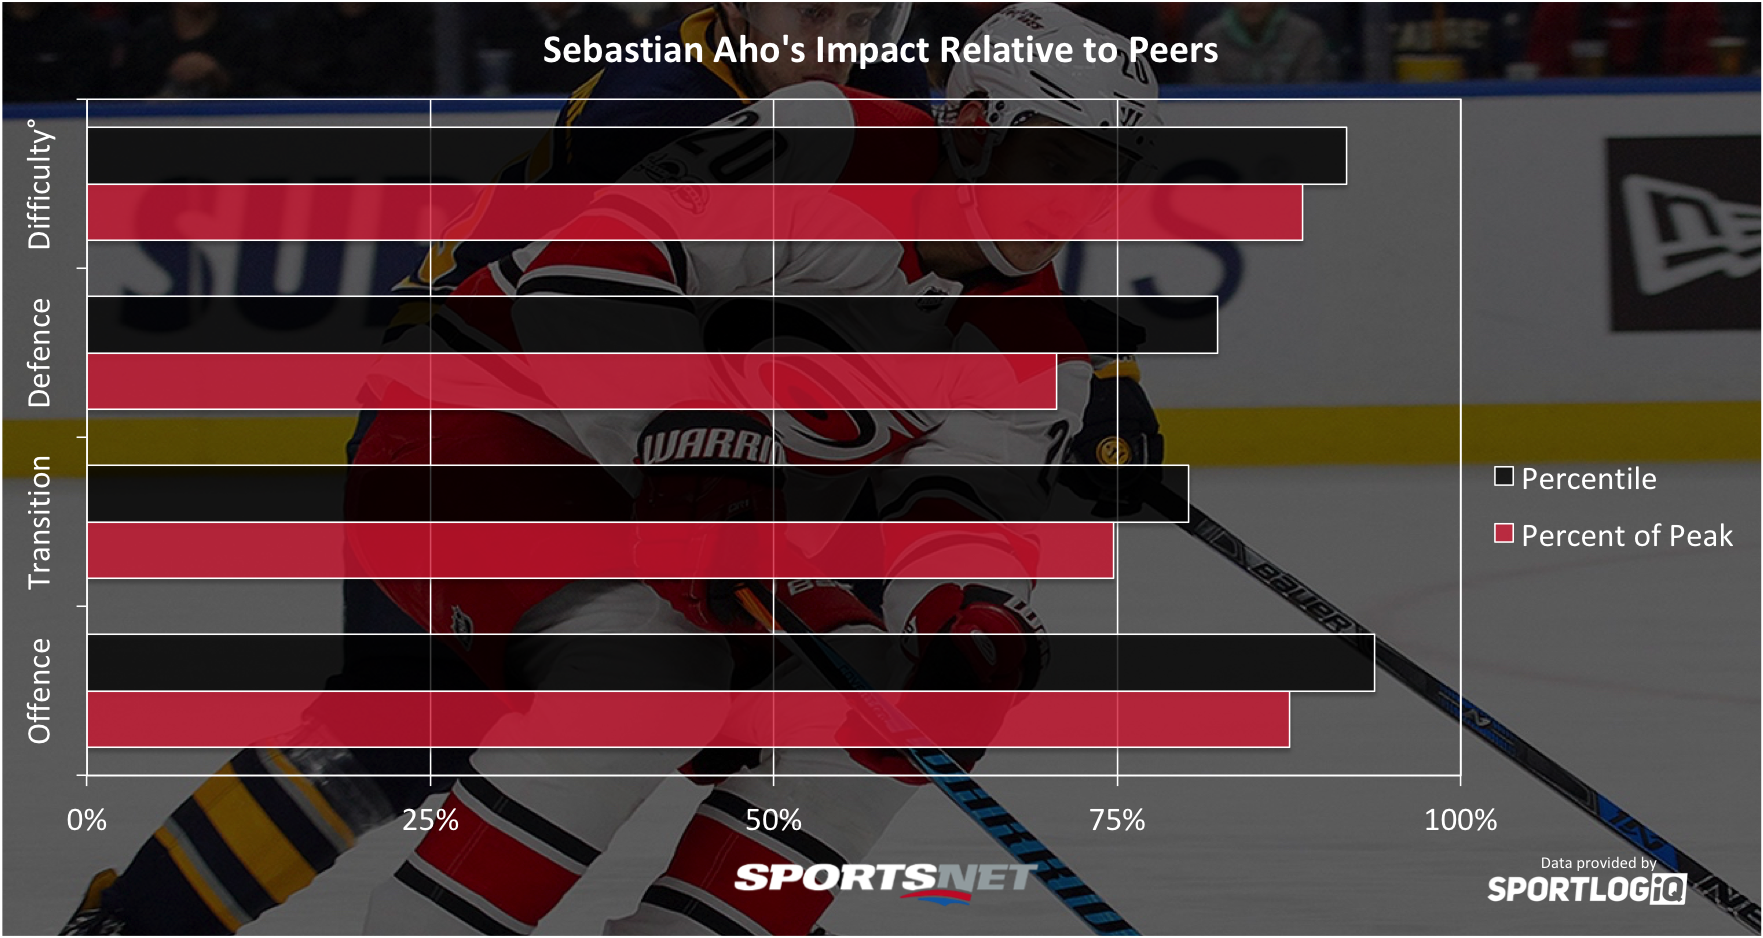
Two seasons into his NHL career, Aho has given the Hurricanes incremental improvement and looks like a budding star player. In his sophomore season, Aho improved a little bit in each aspect of the game and took on significantly more difficult minutes, all while becoming a consistent producer that the Canes have desperately needed.
In transition, Aho is a good zone exit player, but he excels at moving the puck in the neutral zone and creating better lanes for both himself and his teammates to gain the offensive zone. He doesn’t make many passes in the defensive zone, but his involvement in breaking up plays makes things easier for his teammates.
6. David Pastrnak
Difficulty adjustment: +1.99%
Offence: 40.45/60 | Transition: 15.51/25 | Defence: 6.96/15
Total: 62.92/100
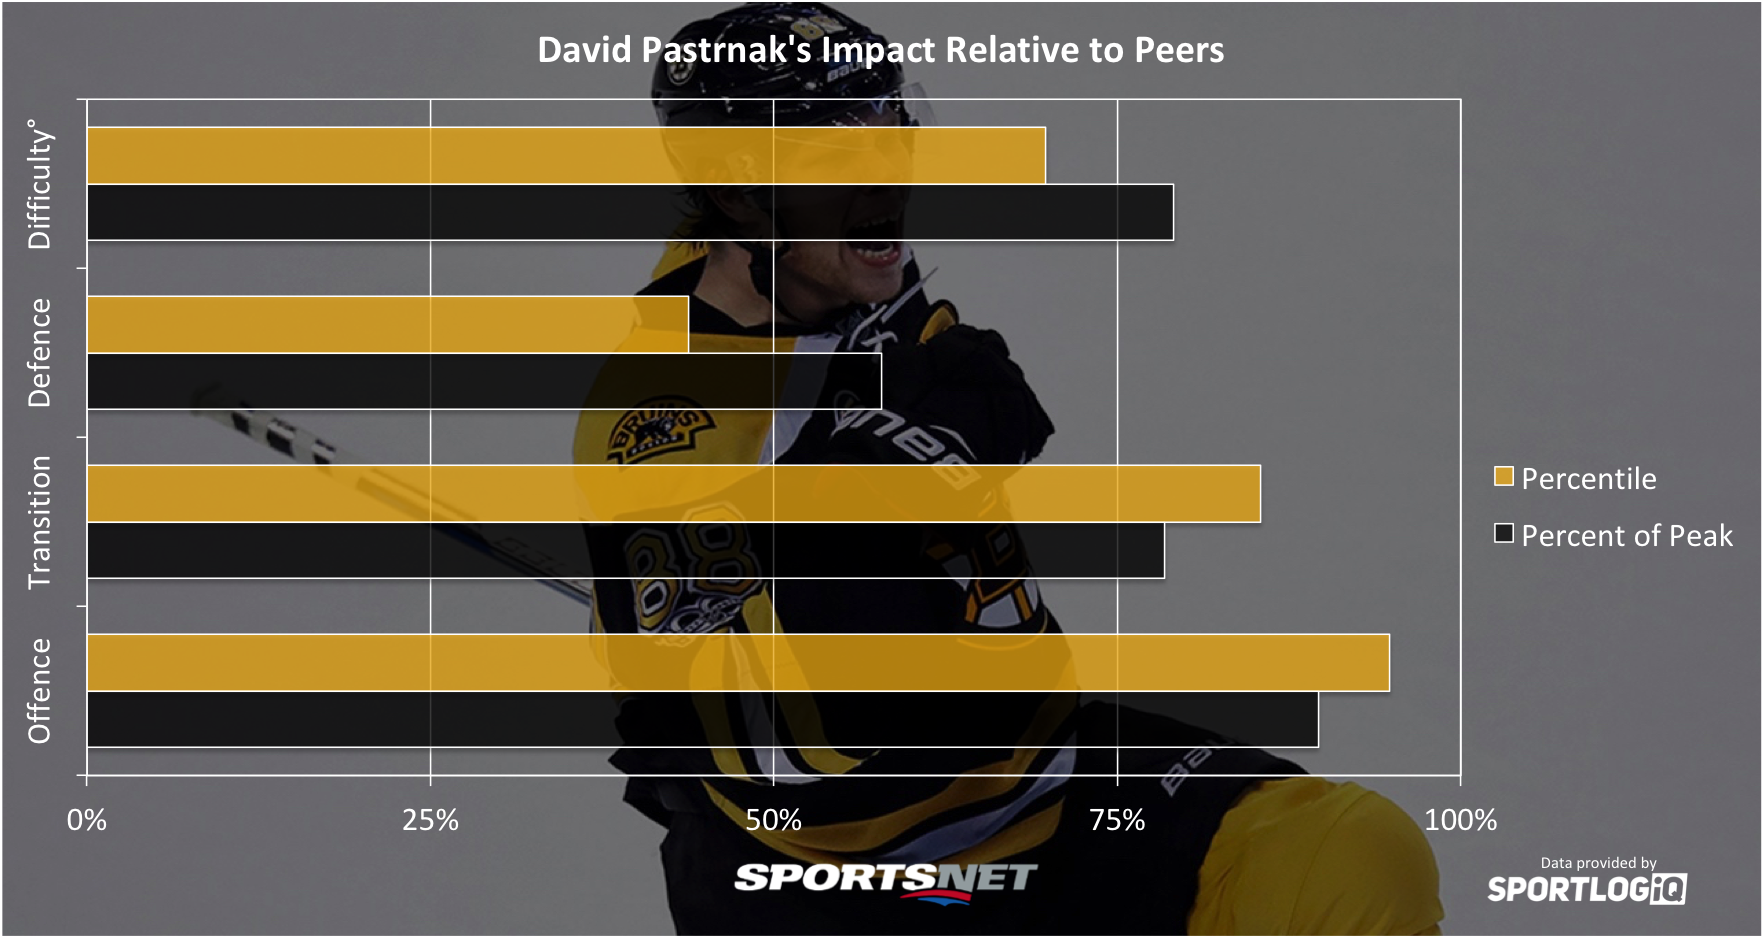
Another phenomenal season from David Pastrnak on the NHL’s best line sees him move up the list by three spots, mostly due to an improvement in his play without the puck. Pastrnak remained offensively consistent as a two-pronged threat on a line full of them, and his transition game was similar to the past two seasons.
Defensively he was far more active at breaking up opponents’ passes in his own zone, and tracked down far more loose pucks. If there’s one area where Pastrnak could improve this season, it would be cutting down his turnover rates. He’s below team average there in all three zones, and can be especially prone to error in the neutral zone.
5. Blake Wheeler
Difficulty adjustment: +6.11%
Offence: 37.57/60 | Transition: 16.20/25 | Defence: 10.38/15
Total: 64.15/100
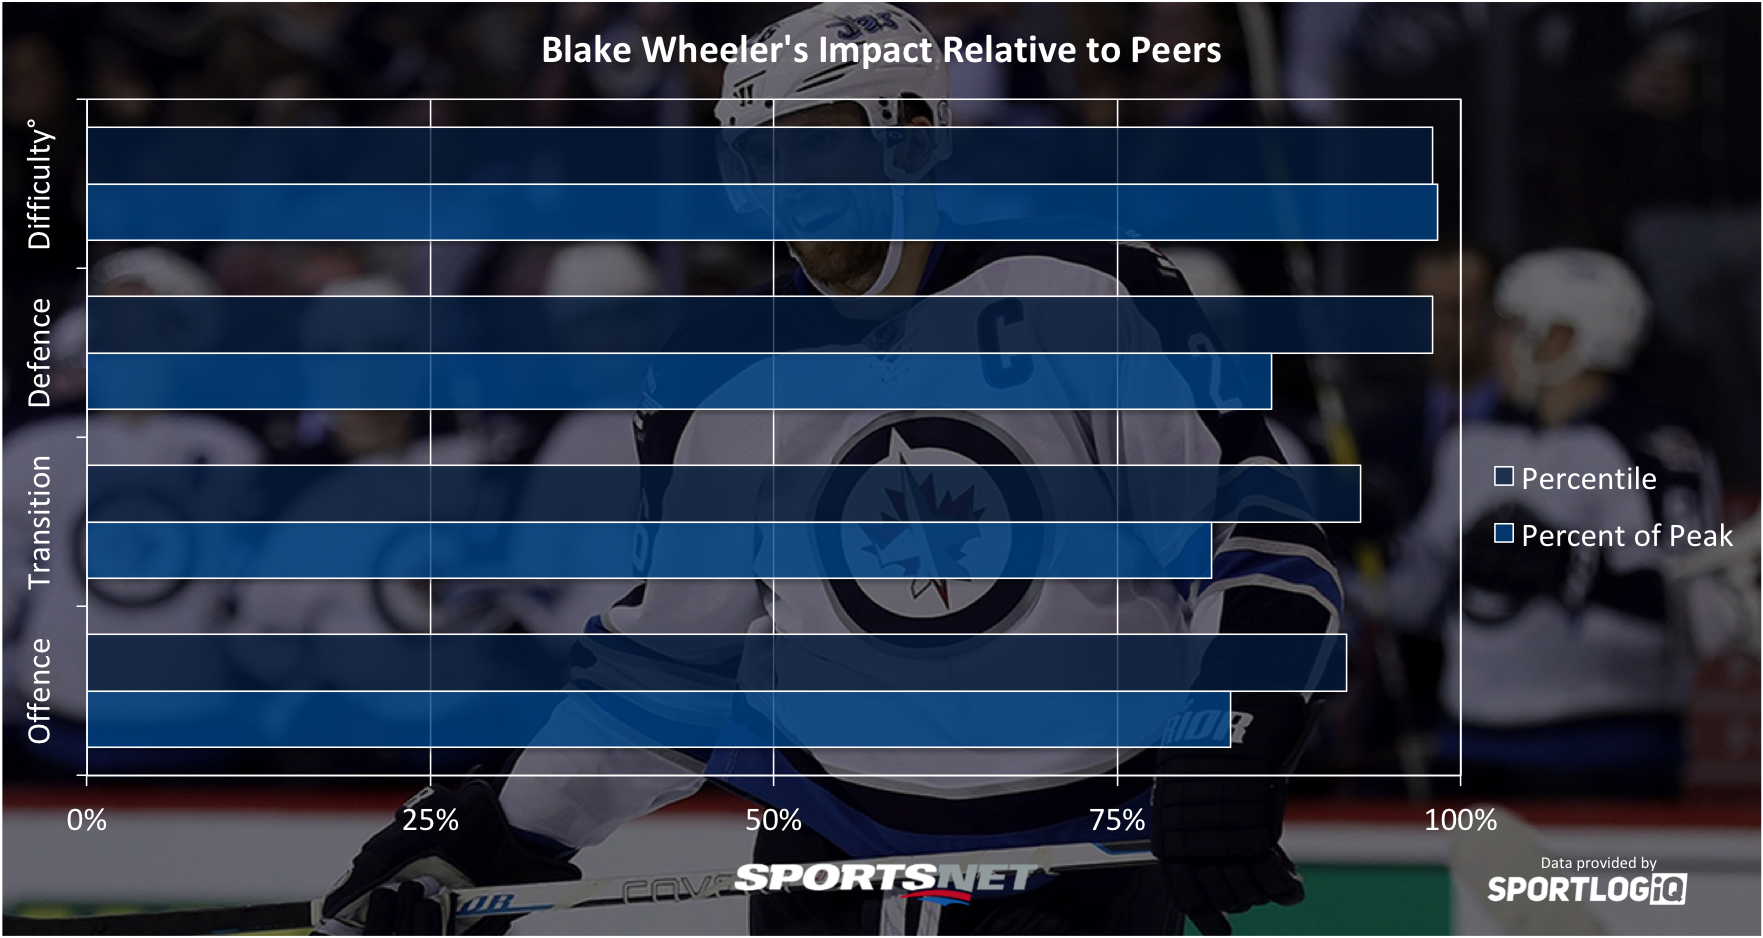
Wheeler had the playmaking season of his career in 2017-18, but surprisingly overall his season was the lowest-ranked of the three in this sample — this is a testament to the dominance he’s shown for a long time now. Last year I mentioned Wheeler was the ideal winger to build a line around if you didn’t have a great centre because of his all-around play, and ironically he had to play centre for an extended period last season when Mark Scheifele was injured, and he did a great job.
The biggest standout for Wheeler last year was his utter dominance on the power play, where only Claude Giroux came close to having the same overall impact on goals. There’s not much Wheeler does poorly, and he does too many things well to list them all.
4. Mark Stone
Difficulty adjustment: +4.27%
Offence: 35.24/60 | Transition: 19.65/25 | Defence: 12.04/15
Total: 66.93/100
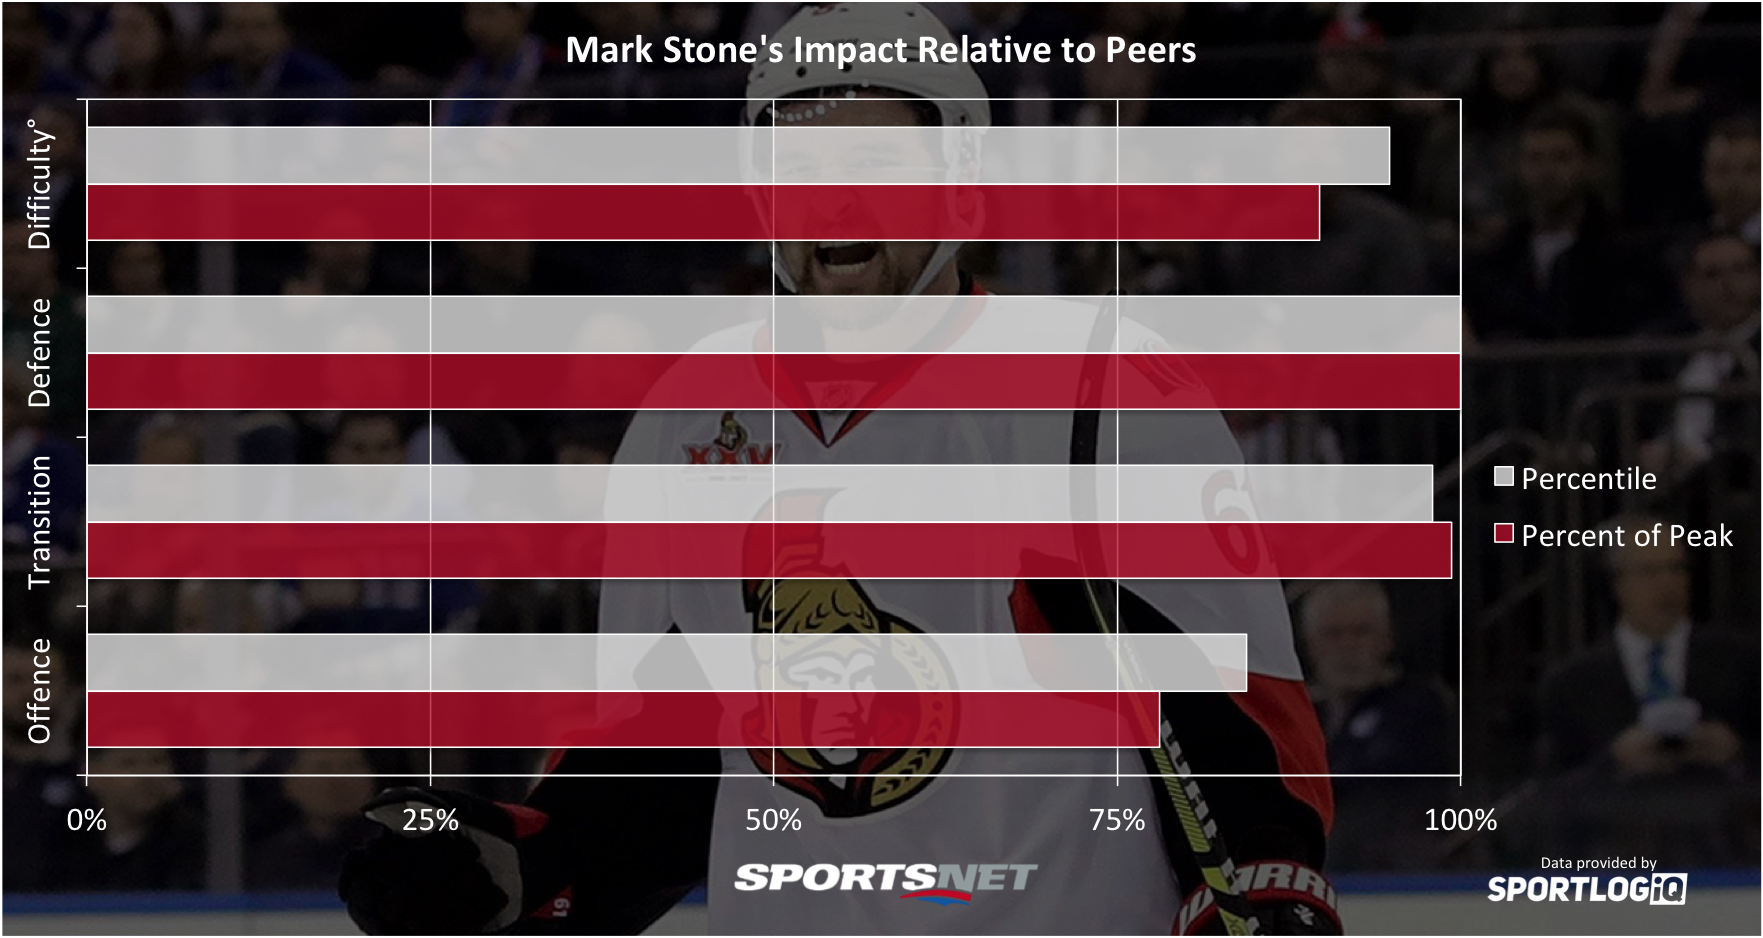
Stone had the best offensive and defensive year of his career last season, and once again took the crown as the best defensive winger in hockey. No winger is involved in even close to as many loose puck recoveries, puck battles, or takeaways as Stone, which is what makes it so impressive that he doesn’t take many penalties.
Stone has a higher puck battle win rate than almost any winger in the league, blocks more passes to the slot than any other winger, and makes more passes in the defensive and neutral zone than any other winger. It’s really going to hurt if the Senators lose him this summer.
3. Vladimir Tarasenko
Difficulty adjustment: +5.52%
Offence: 43.62/60 | Transition; 16.74/25 | Defence: 6.86/15
Total: 67.22/100
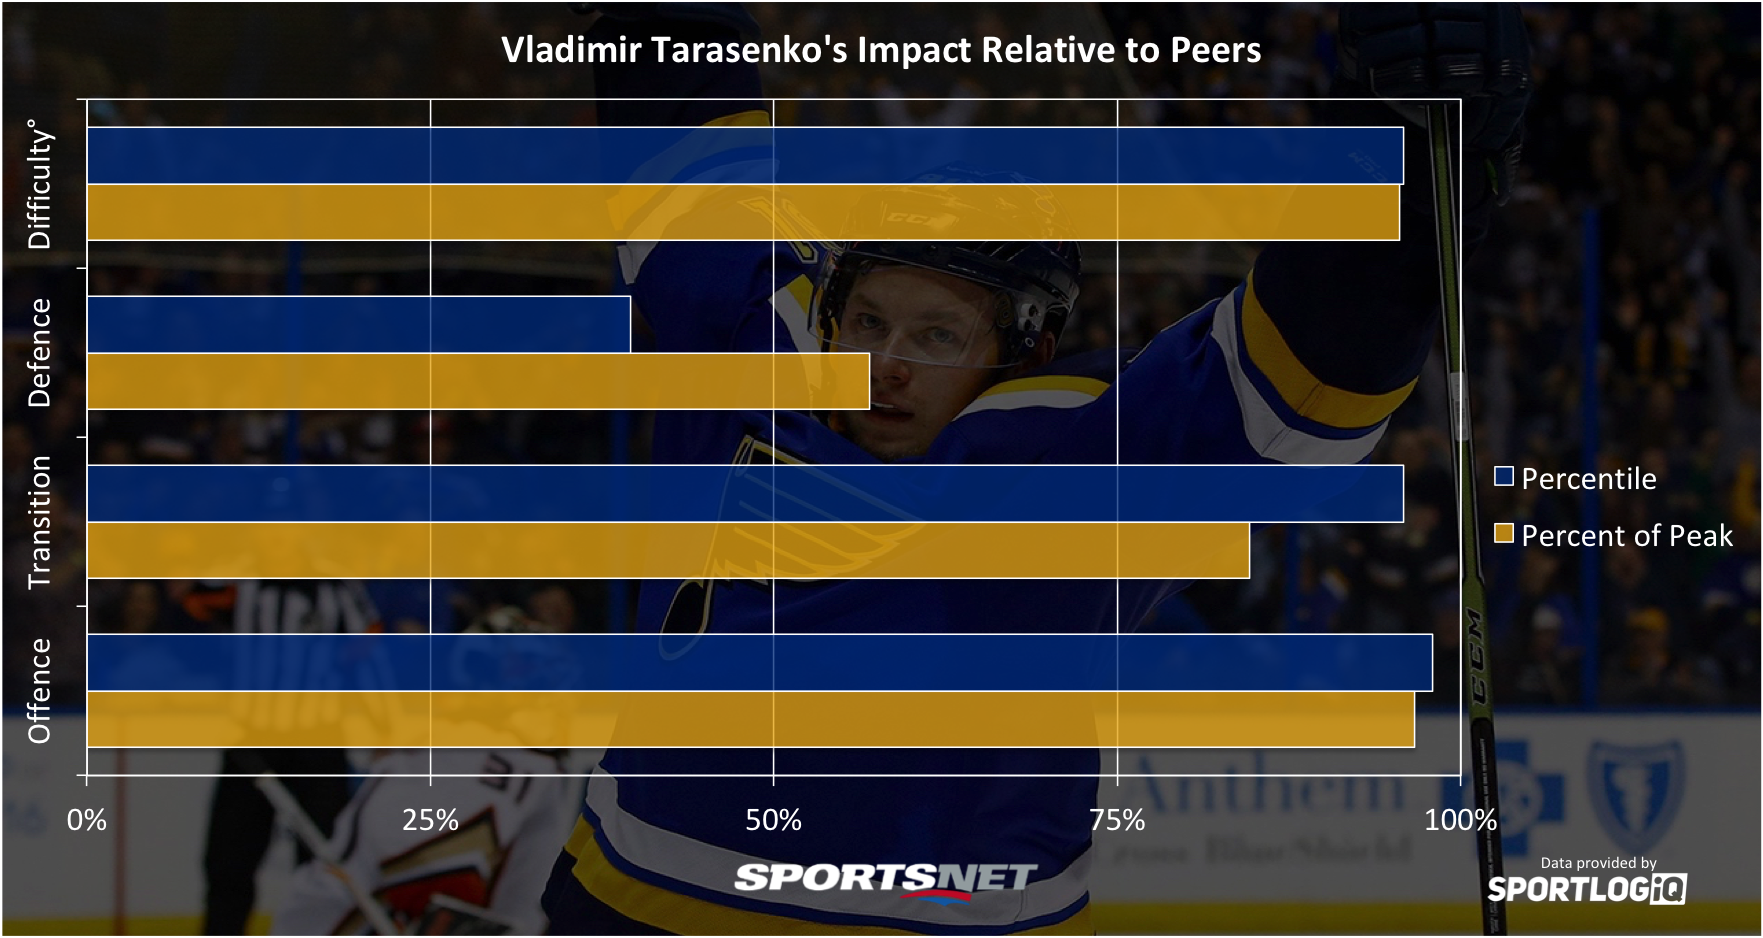
No right winger shoots as often overall or from the slot as Tarasenko does, and he’s done that most of his career by beating opponents one-on-one to get superior vantage points and catch goaltenders moving. Last season the Blues’ top line tossed the puck around a lot more often in the offensive zone, and though Tarasenko put in the work his production didn’t go the way you would expect. One area where Tarasenko could improve offensively is on the power play, where he’s looked decent at times, but mediocre for his skill level.
In transition, Tarasenko is an excellent zone exit and entry option, but through the neutral zone he prefers to pass the puck off to teammates. Not much has changed for Tarasenko defensively — he doesn’t get very involved in attacking opponents or recovering loose pucks, though when he does get in a puck battle his big frame keeps him in the win column more often than not.
2. Patrick Kane
Difficulty adjustment: +6.48%
Offence: 42.06/60 | Transition: 19.78/25 | 6.34/15
Total: 68.19/100
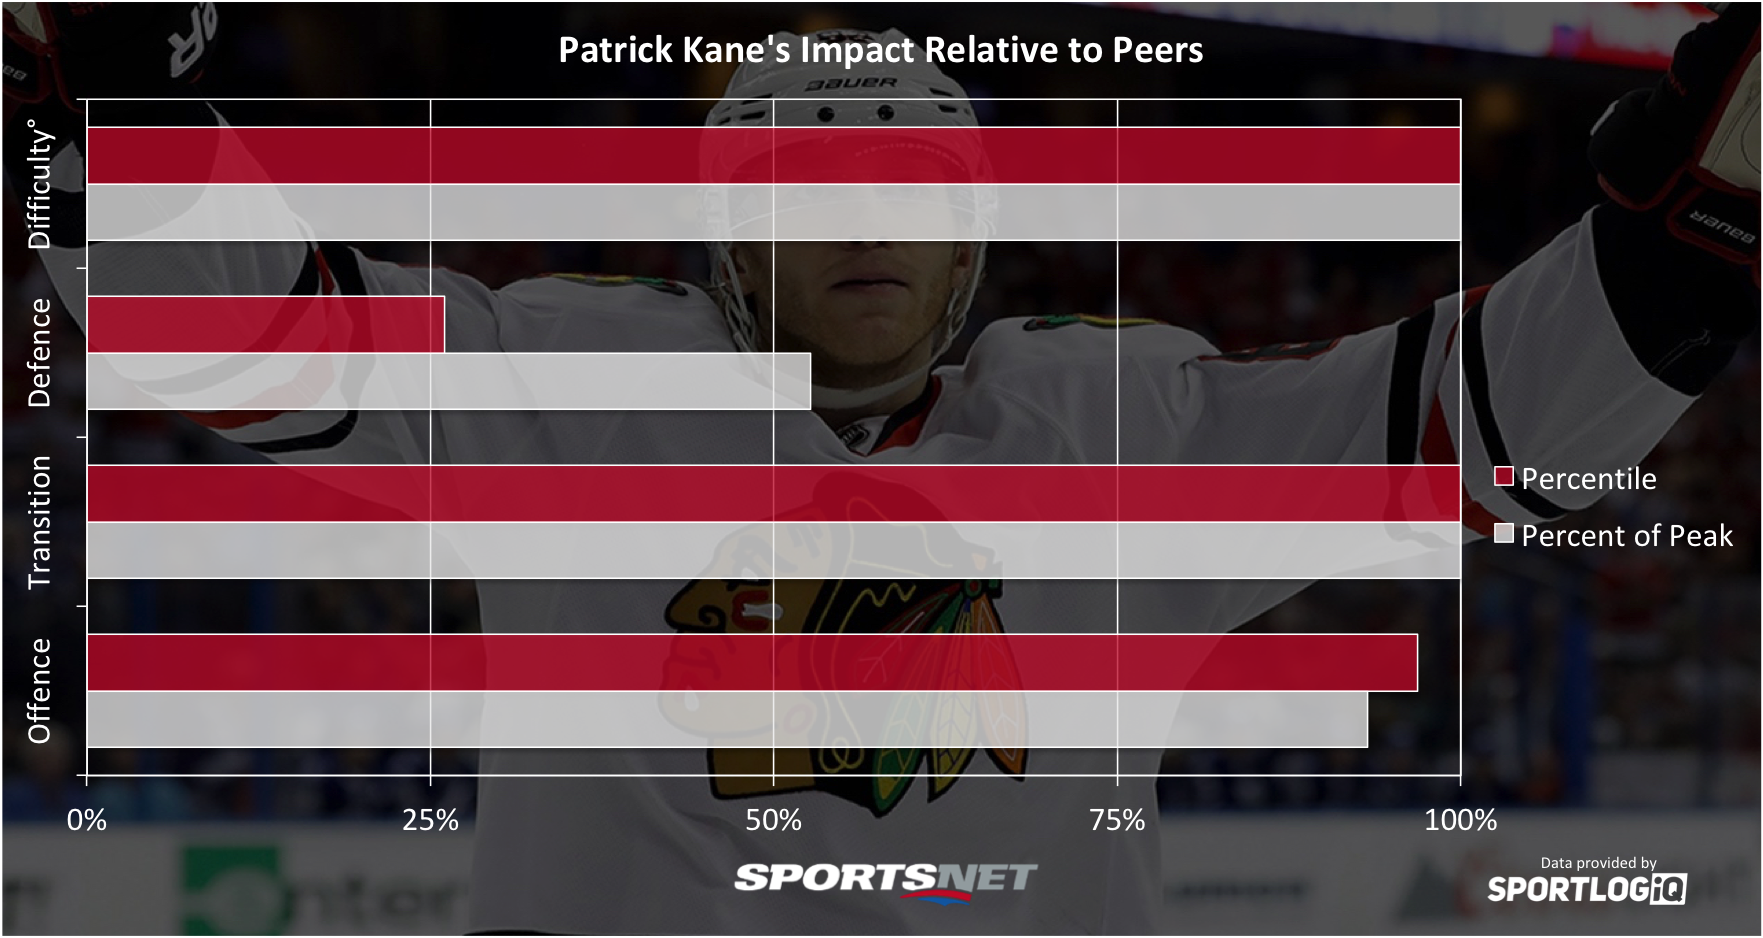
Last year’s No. 1 right winger was unseated after a bit of an offensive drop off for a second straight year. Kane remains an extremely creative offensive weapon, a dangerous shooter and elite playmaker, but he seemed to miss Artemi Panarin.
Kane remains the NHL’s most impactful transition player on the right wing, as no one else is able to carry the puck up the ice with the same frequency or efficiency. His incisive passing in the defensive and neutral zones makes his teammates better transition player as well. Still, Kane isn’t a great defensive player, but at the very least he keeps his penalties low. Overall, Kane plays the toughest minutes of any player at his position, which makes his consistent production more impressive.
1. Nikita Kucherov
Difficulty adjustment: +5.59%
Offence: 45.14/60 | Transition: 19.31/25 | Defence: 9.28/15
Total: 73.73/100
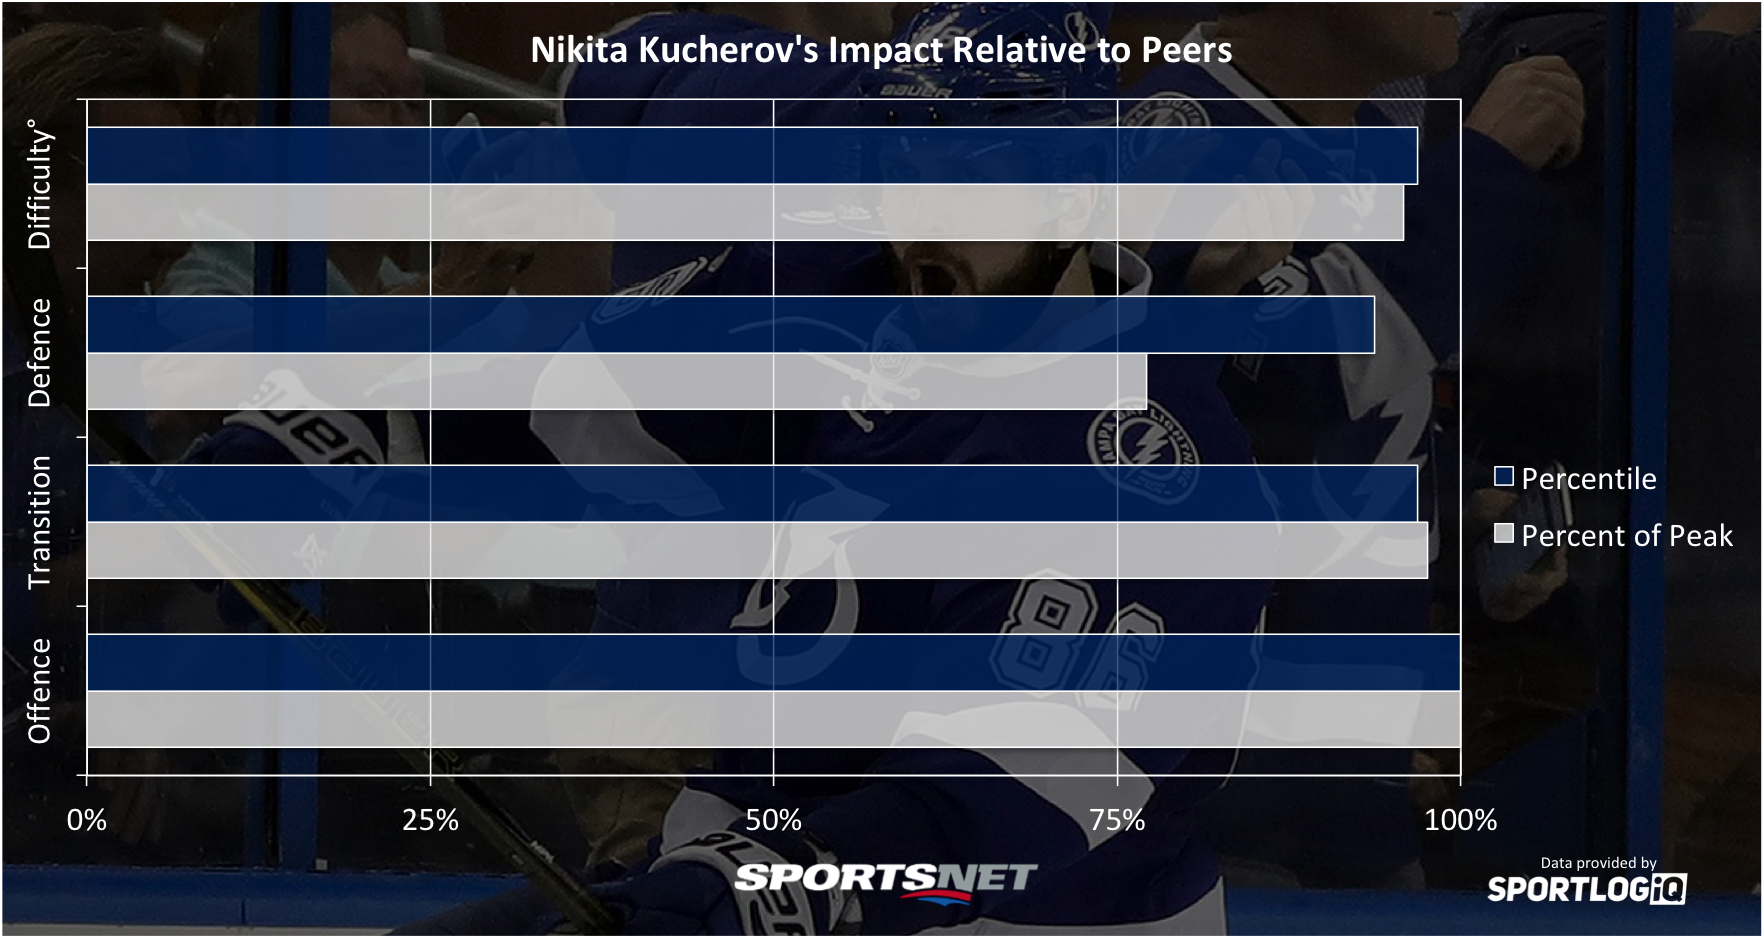
Nikita Kucherov’s trajectory to becoming the best player at his position was a steep incline, and over the past three seasons the gap between him and Kane is getting larger. A lot of other wingers in the NHL who score at rates comparable to Kucherov are fairly weak without the puck, but he isn’t.
For three seasons now Kucherov has balanced his improving offence with strong defensive play, with a focus on winning loose puck battles and managing the puck in a way that doesn’t create turnovers or sacrifice offence. Last season he ranked as the top zone exit player at his position, and was second-best in zone entries to only Phil Kessel. It would take a lot for anyone to unseat Kucherov next season.


