Goal-based analysis in hockey can be a tricky proposition. On the one hand, the whole purpose of the game is to find a way to score more than your opponent, which means that a premium is placed on information regarding who’s scoring and, inversely, who’s getting scored on.
But aside from extreme examples on both ends of the spectrum, things get murky because point generation can be awfully fickle for most players. There’s a large group of players who go through successive peaks and valleys through no direct fault of their own — it could be because of how the puck is bouncing on a given night, or how their linemates are performing. This is not the most satisfying realization if you’re the type of person who prefers things to be cut and dried, but hockey is very subject to chance.
That’s why it’s important to remember – particularly during the lows, when it’s easy to be frustrated and overreact in a blind rage – that your team’s favourite punching bag isn’t the only “streaky” scorer out there. Generally, everyone is streaky.
One way to sort through a lot of that noise is to hone in on the production a player is responsible for, casting the rest of it aside. That means dropping secondary assists, since they far too frequently reward someone for simply happening to be around at the right time (especially for those who benefit by skating alongside great players).
Instead, let’s focus on the times where a player either put the puck into the back of the net himself or was the one who got it directly to the goal scorer. Obviously there will still be occasions that fall through the cracks and primary assists that are undeserved, but it paints a clearer picture of who actually contributed something meaningful to their team’s offence.
Taking things one step further, let’s differentiate between who’s been driving the results offensively this season versus who is just along for the ride. To do this, we’ll look at the total number of goals an individual player’s team has scored when they’ve been on the ice, and what percentage of those goals the player was personally in on:
| PLAYER | PRIMARY POINTS | ON-ICE GOALS FOR | INDIVIDUAL PRIMARY POINT % |
|---|---|---|---|
| Matt Duchene | 10 | 11 | 90.91 |
| Bo Horvat | 9 | 10 | 90 |
| Sidney Crosby | 12 | 14 | 85.71 |
| Auston Matthews | 10 | 12 | 83.33 |
| Charlie Coyle | 9 | 11 | 81.82 |
| Scott Hartnell | 9 | 11 | 81.82 |
| Jeff Carter | 12 | 15 | 80 |
| Nathan MacKinnon | 8 | 10 | 80 |
| Rickard Rakell | 8 | 10 | 80 |
| Steven Stamkos | 11 | 14 | 78.57 |
| Connor McDavid | 17 | 22 | 77.27 |
| Kyle Turris | 9 | 12 | 75 |
| Brandon Saad | 10 | 14 | 71.43 |
| Phil Kessel | 10 | 14 | 71.43 |
| Evgeni Malkin | 12 | 17 | 70.59 |
(all data is during the course of 5-on-5 play and via the invaluable Corsica)
A few quick mandatory caveats before we unpack this:
This early into the season these numbers tend to be stretched out, and as the games accumulate they’ll bunch back together towards a central mean (expect the top guys to regress back down to somewhere in the range of the high-70s based on past history).
The other thing worth noting is that while these numbers describe what’s already happened, that doesn’t necessarily mean they’ll also predict what’ll happen in the future. That’s not to say it doesn’t still have its utility, but those are two entirely different concepts.
With that out of the way, a lot of the names appearing near the top of this list are ones we’ve come to expect offensive greatness from. It obviously helps that Sidney Crosby is converting more than a quarter of his shots into goals, but that shouldn’t take away from the fact he is on another level right now. Despite everyone’s desire to see the keys to the league handed over to the next generation (and it’s coming soon), Crosby is showing they won’t be easy to take from him.
When the torch is passed Connor McDavid will be there to receive it and he already looks poised to run away with the Art Ross Trophy this season like many predicted. It’s impossible to overstate just how impressive he’s been as essentially a one-man team for large stretches so far. For some added context: the Oilers have scored 22 five-on-five goals with McDavid on the ice versus just 25 total while he’s been on the bench.
Despite Auston Matthews’ 13-game drought where he cobbled together just three assists, everything on the Leafs offence seems to run through him when he’s on the ice. Despite that stretch he’s still well on his way to a sensational rookie season and assuming he continues to generate the kind of shot volume he has thus far, there’s no reason to believe he won’t get there.
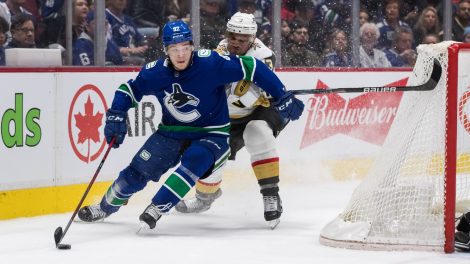
Perhaps the most surprising name on the list is Bo Horvat, whose play might not be drawing the attention it deserves because of his abominable surroundings in Vancouver. He’s been following a steady progression as a prospect since being drafted, but now he certainly looks like a player who’s ready to make the most of a bad situation and start shouldering a heavy load all by himself. There’s recently been talk of the Canucks looking to sign him to a long-term extension. They’d do well to lock him up for a long time before his price tag skyrockets. In a lost season where there doesn’t appear to be much to build around, he looks like the rare exception in Vancouver.
The comparison to defencemen here is worth mentioning. Whereas your typical forward will get a primary point on somewhere in the ballpark of 45-55% of the goals his team scores when he’s on the ice (less-skilled bottom-six types can drop all the way to 25-30%), that number is closer to 10-15% for defencemen on average. Even on the absolute high-end, there have only been a couple of blueliners to make their way above 40% over the course of a full season since 2007:
| PLAYER | SEASON | PRIMARY POINTS | ON-ICE GOALS FOR | INDIVIDUAL PRIMARY POINT % |
|---|---|---|---|---|
| Victor Hedman | 20132014 | 24 | 53 | 45.28 |
| Brent Burns | 20152016 | 27 | 63 | 42.86 |
| Mike Green | 20142015 | 17 | 42 | 40.48 |
| Brent Burns | 20142015 | 23 | 58 | 39.66 |
| Erik Karlsson | 20112012 | 32 | 81 | 39.51 |
| Michael Del Zotto | 20142015 | 16 | 41 | 39.02 |
| Erik Karlsson | 20152016 | 29 | 77 | 37.66 |
| Roman Josi | 20152016 | 20 | 54 | 37.04 |
| John Carlson | 20152016 | 15 | 41 | 36.59 |
| Oliver Ekman-Larsson | 20142015 | 16 | 44 | 36.36 |
| Shea Weber | 20082009 | 20 | 50 | 36.36 |
| Mark Giordano | 20152016 | 22 | 61 | 36.07 |
| Kevin Shattenkirk | 20102011 | 18 | 51 | 35.29 |
| Erik Karlsson | 20132014 | 25 | 72 | 34.72 |
Erik Karlsson and Brent Burns are generationally great players, and single-handedly move the needle for their teams in nearly unprecedented ways. That makes them the notable exceptions to the rule, though, because most of their peers have to find other ways to contribute more subtly, which doesn’t always show up in the boxcar totals on their player page.
I think this serves as a valuable reminder of why people in the hockey community are searching high and low to find more nuanced ways to tangibly evaluate how defencemen are influencing on-ice results for their respective teams. A lot of time is being devoted to tracking passing plays, zone exits, and the defence of zone entries because it’s especially difficult to use scoring as evidence of how well a defenceman has played.