One of the most common frustrations you hear in the hockey analytics community is that “goalies are voodoo.” That frustration comes from the general lack of predictive power we have over future goaltender performance compared to the relatively robust analysis that can be done on skaters.
The issues with predicting the position have been put on the goalies themselves more often than not, but the truth is that the data available to judge goalies with is far more limited than what we have for skaters.
For skaters we can look at shot differentials, zone entries and exits, loose puck recoveries, possession changes, possession time, and so much more. For goalies we are mostly limited to shots. Save percentage is based on shots, expected save percentage is mostly based on shots, with more detail.
Of course, we can break down how often a goaltender makes passes and look at completion rates, zone exits, turnover rates, and more, but most of what people care about with goaltenders is save performance, which means the job of goaltenders is seen more simply. That should make it easier, but so far it seems to make analysis far less reliable.
Limited as they may be, goaltending metrics are expanding their scope and veracity all the time, so let’s play some fact or fiction on a few goalie questions pertaining to the upcoming Stanley Cup Playoffs.
[snippet id=4167285]
Is Darcy Kuemper really this good, or a product of his team?
After six seasons of being about a league average or slightly better backup goaltender, Darcy Kuemper has given the Arizona Coyotes two seasons of absolute brilliance playing starter minutes while healthy. In over 84 games and facing 2,580 shots, Kuemper has stopped a baffling 92.6 per cent of the rubber he’s faced, keeping a relatively mediocre team in the playoff hunt two years running.
Kuemper has posted those gaudy numbers in two seasons where the average save percentage has dropped to a hair above .910, and over that time only Ben Bishop in the Dallas Stars’ smothering defensive system has posted a superior raw save percentage — 92.7 per cent.
Kuemper spent his career before Arizona split between the Minnesota Wild and Los Angeles Kings, two teams that are notoriously strong defensively, so it would appear that it shouldn’t just be Arizona’s system propping him up, but what does the data say?
At 5-vs-5 Kuemper places 15th in inner slot save percentage and 10th in slot save percentage this season, but we already know he’s strong in save percentage, so what kinds of shots is he facing?
Let’s look at Kuemper’s per-game difficulty of shots faced compared to the league average goaltender this season.
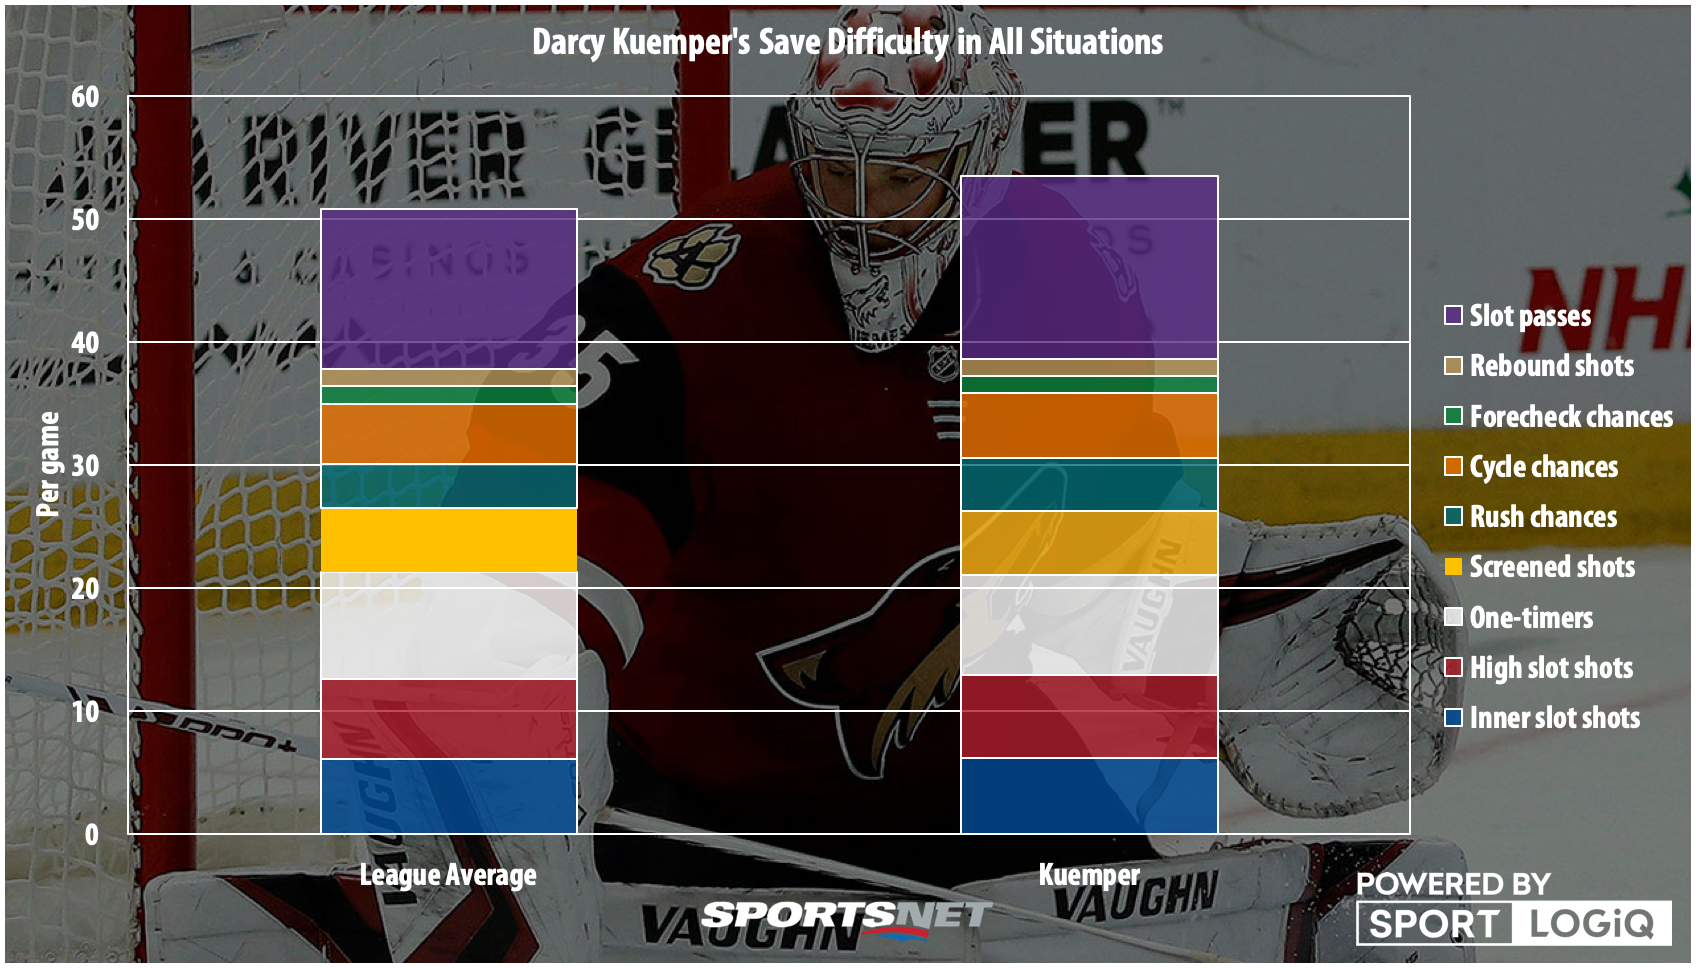
It’s important to note here that in reality, these metrics are not additive in this way. All cycle chances, rush chances, and forecheck chances as recorded take place within the slot, so they’re all either high slot or inner slot shots. Many one-timers are in the slot as well, as are rebound chances. What putting this all together in a stacked bar chart accomplishes is to put together all these factors that make shots a goaltender faces more difficult, and see how many of those factors a goaltender is encountering in one average game.
Though many assume the Coyotes are a good defensive team, when you add everything up together, Kuemper has actually faced slightly tougher shots than an average goaltender. The biggest areas where he has had to step up are in facing shots off the rush, where the Coyotes give up 22.1 per cent more than an average team, and in accounting for slot passes, where the Coyotes give up 14.2 per cent more than the average team.
Everywhere else the shot difficulty Kuemper faces is about average, but the important thing here is that we’re looking to see if he’s been put in a drastically easier situation than other goaltenders, and if that’s boosted his numbers.
It’s pretty rare to see a goaltender struggle to establish themselves in the league throughout their 20s and then become brilliant at the end of their 20s and into their 30s, but the idea that Kuemper is simply a product of a stingy Arizona defence appears to be fiction.
[snippet id=3816507]
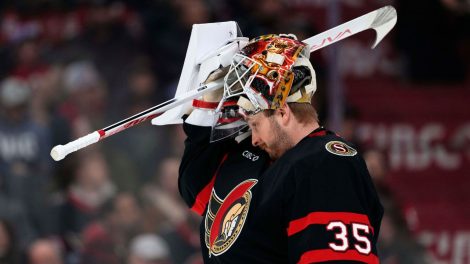
Is Carey Price still feared around the league?
When the NHLPA released its player poll and cited Price as the NHL’s best goaltender with a whopping 41.55 per cent of the vote, some eyebrows were raised. Price had a very underrated, elite level 2018-19 season by numerous metrics that aren’t publicly available, but was seen as being just okay based on public stats. He was the top voted goaltender by the NHLPA last season as well, but only took home 29.9 per cent of the vote.
It’s a little strange to see Price’s vote share grow despite both public and private metrics show he had a down season, but memories are long and reputations stick with players.
I’ve touched on Price’s trends recently, as well as how much blame he should get for the Canadiens’ underwhelming season, but players actually shooting on the goalies should get some benefit of the doubt, right? Shouldn’t they know who is the toughest to score on? Is there something we’re missing that puts Price back in contention among the best?
When this question was asked last season, Paul Campbell wrote for InGoal Magazine about the deeper numbers that supported Price as among the league’s best, but Price’s numbers were much better a year ago.
As I mentioned in the Analytics Mailbag after the season was put on hold, the Canadiens are a far better defensive squad this season compared to last, so what are we missing? Let’s look at the same difficulty metrics for Price that we looked at for Kuemper.
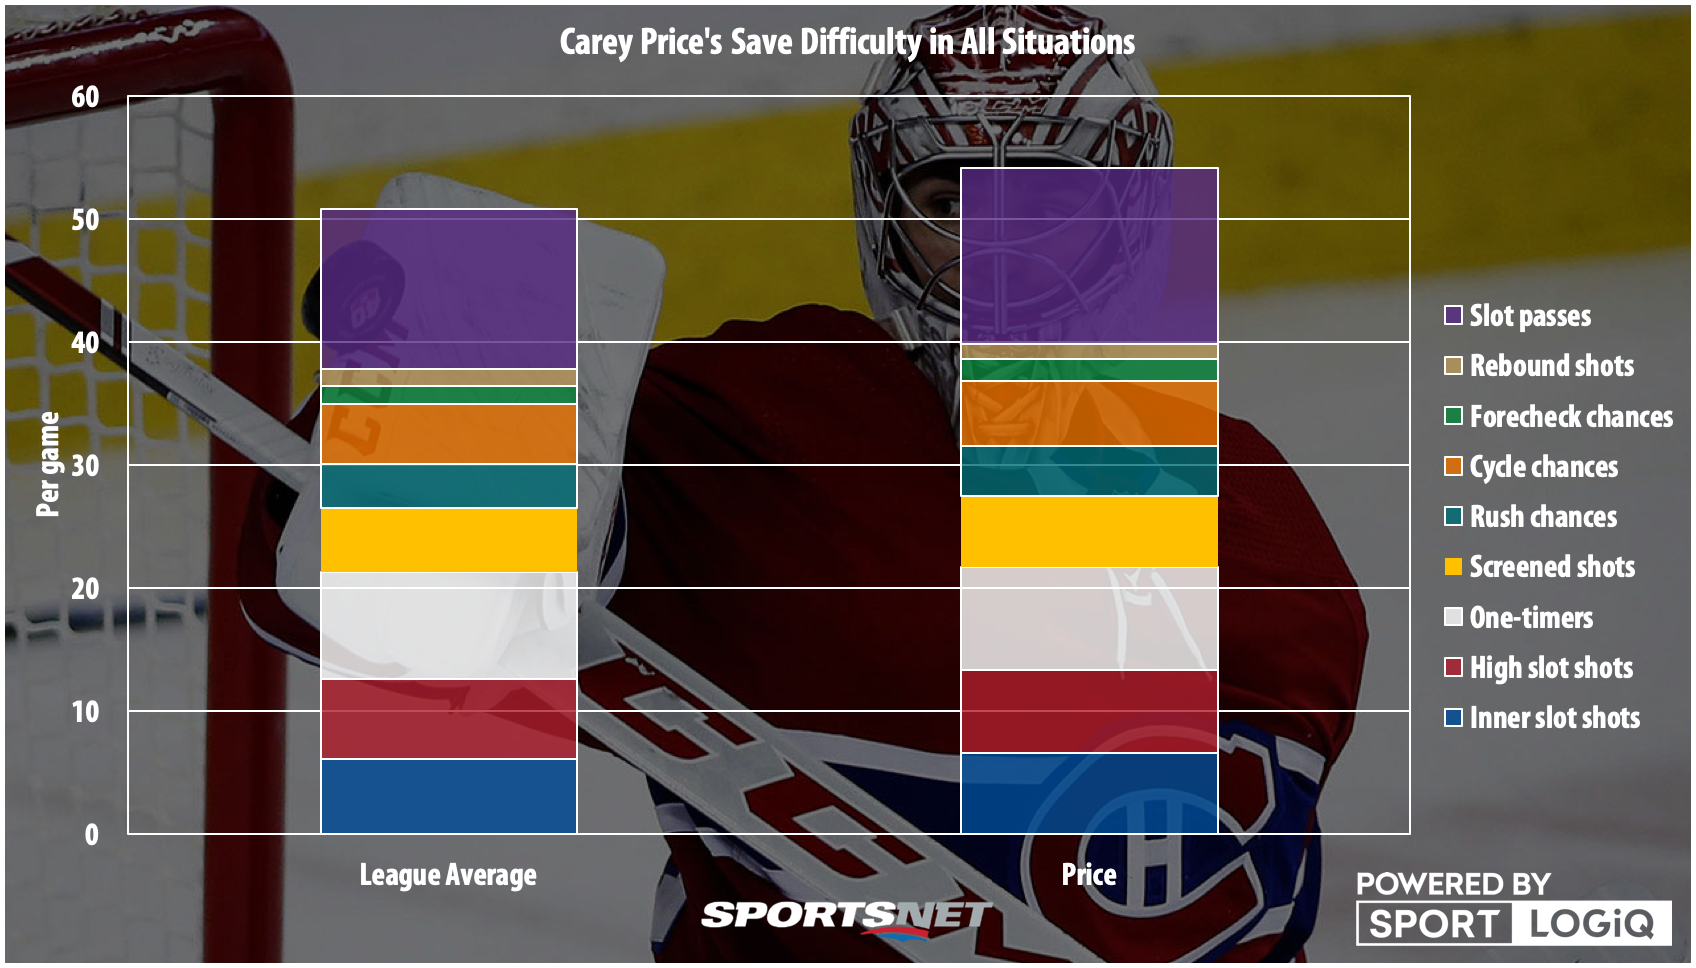
Like Kuemper, Price is facing slightly higher difficulty on his shots than an average goaltender, but unlike Kuemper it isn’t really one area that’s sticking out — it’s a bunch of them. Price faces eight per cent more shots from the inner slot, four per cent more from the high slot, 11 per cent more screened shots, 14 per cent more rush chances, 10 per cent more cycle chances, 14 per cent more forecheck chances and 10 per cent more slot passes than an average goalie. There’s nothing too egregious on its own, but overall it’s very chaotic in the Habs’ end.
Price does face fewer rebound shots than the average goaltender, but this is probably more to do with him still having the best rebound control in the league, even while struggling.
Overall, while Kuemper faced a 5.2 per cent higher difficulty than an average goalie this season, Price’s was 6.5 per cent more, so it wasn’t that big of a gap between the two.
The numbers for this season don’t support Price being the big difference maker that players believe he is, but he was that as recently as last season. It may be fiction on paper, but in a five-game series I understand why teams are on edge.
Should Juuse Saros start the playoffs for Nashville?
With Pekka Rinne posting a .895 save percentage this season to Saros’ .914, it seems like an easy pick to say the goaltender with the superior numbers in a couple hundred more minutes played should take the starter’s net when the games come back.
But it’s never that easy.
Earlier this season I broke down Rinne’s numbers to see how bad his decline was, and as it turned out there was just one specific struggle that was keeping him down: extremely poor play on slot shots while shorthanded.
At 5-vs-5 Rinne has been declining for a little over the past two seasons, but his numbers remain extremely respectable and way above league average. However, he’s been getting killed while shorthanded all season long, posting among the worst inner slot save percentages in the league at barely above half.
Whether you think that’s random noise on relatively few shots or a harbinger of things to come is up to you, but overall Rinne looked much stronger than it appeared on the surface. At 5-vs-5, Rinne outperformed Saros from the inner slot, high slot, and perimeter while boasting superior rebound control.
In all game modes combined, though, Saros has the edge from each area, and the rebound control comes up even. So, is there anything else that could swing things back to Rinne? Let’s look at the difficulty each goalie faced.
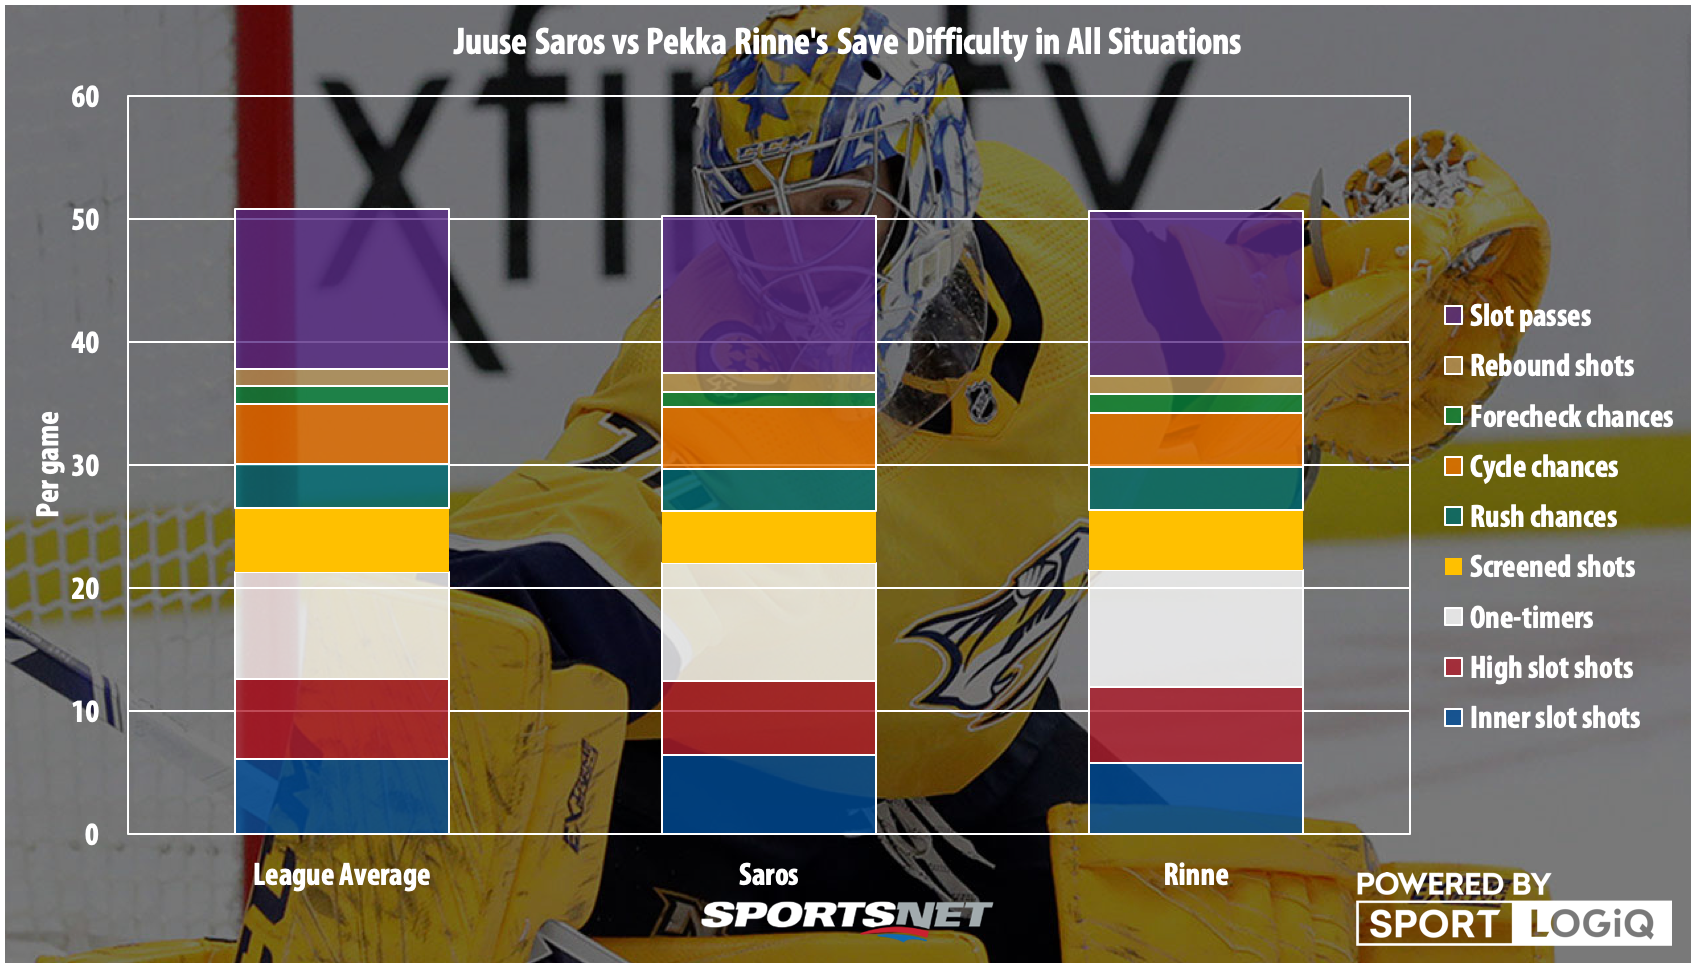
Both goaltenders have faced slightly less than league average shot difficulty, with Rinne having to worry about more slot passes and forecheck chances, while Saros dealt with more cycle chances and more inner slot shots than Rinne did.
Overall, there’s not much worth differentiating them in terms of difficulty, and even if Rinne’s struggles were all in one area, Saros simply hasn’t had those struggles this season. One of the reasons Saros has been so consistent might be how sound he is positionally, and because of that consistency, this one is a fact: Saros should start.
[relatedlinks]