The mid-season Vezina poll conducted at NHL.com provides a useful window into the way goalie quality is usually perceived. The top contenders are brand-name goaltenders whose reputations are well-established:
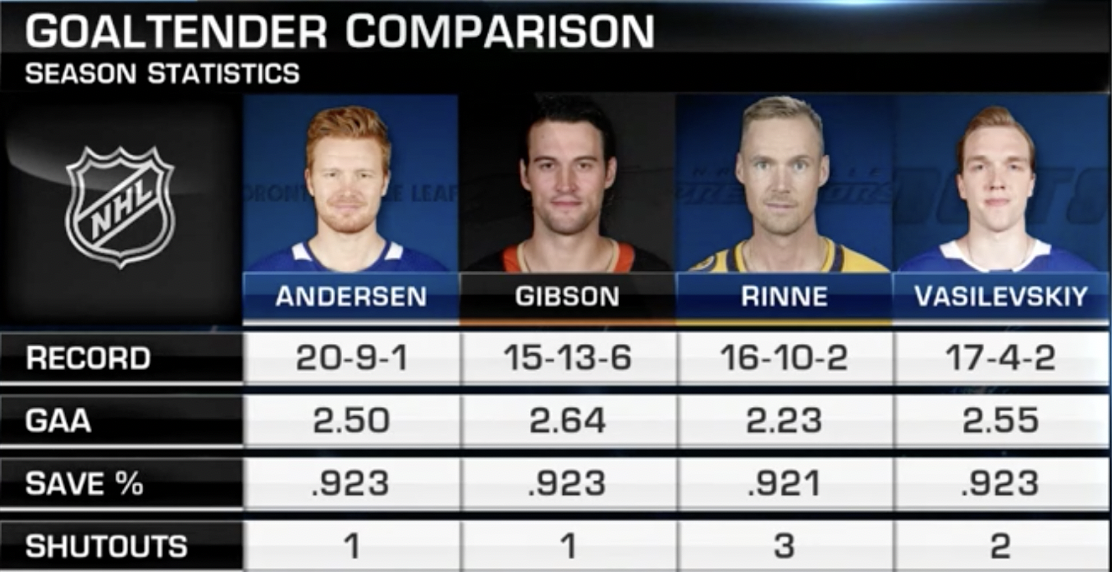
These goalies are all turning in strong performances this season but, aside from poor John Gibson, they all play behind excellent teams clustered in or near the top five in the league.
Historically, wins have mattered a lot to the general managers who vote for the Vezina, and only one non-playoff goaltender has ever won the award (Sergei Bobrovsky in a lockout-shortened 2012-13 season). As a result, our thinking about Vezina-worthy goalies tends to centre on well-known keepers on strong teams.
The injustice of choosing the best goaltender based in large part on team success is apparent, especially in this era where fewer than a quarter of the league’s starters surpass the 60-game mark. Even the stats presented in the graphic above, like goals-against average and save percentage, fail to account for the highly variable quality of shots faced by different goaltenders. Without accounting for degree of difficulty, the statistics don’t say much about who the top performers really are.
Determining the actual quality of shots faced for every goalie is no easy task, but it is being done. A company called Clear Sight Analytics, (https://www.csahockey.com/) headed by former NHL goaltender and current MSG analyst Steve Valiquette, tracks multiple elements of every shot situation that determine their difficulty. Shot location, distance, and especially pre-shot movement like passing and rebounds are accounted for, giving the most complete evaluation of shot quality available.
Of their top five performers as of December 31 (shortly before the NHL.com ranking was released), there’s only one well-established star based on how far their actual save percentage outpaces expectation relative to shot quality:
| PLAYER | TEAM | EXPECTED SV% | ACTUAL SV% | PLUS/MINUS DIFFERENTIAL |
|---|---|---|---|---|
| Jaroslav Halak | Boston Bruins | 0.873 | 0.916 | 4.30% |
| David Rittich | Calgary Flames | 0.877 | 0.911 | 3.30% |
| Robin Lehner | New York Islanders | 0.889 | 0.919 | 3% |
| John Gibson | Anaheim Ducks | 0.886 | 0.915 | 2.90% |
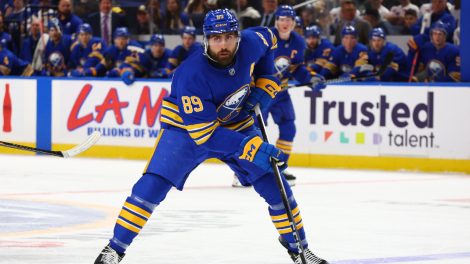
| Carter Hutton | Buffalo Sabres | 0.882 | 0.909 | 2.70% |
If I had presented this list as my prediction of top mid-season goalie performers in September, I’d have been out looking for a new line of work by October. That is precisely why this kind of thorough shot quality-based assessment is so useful: it helps us lay some of our biases and preconceptions aside and uncovers some deserving names that would otherwise be unfairly overlooked.
Digging into the numbers
Plus/minus save percentage differential, known as delta save percentage elsewhere, is a far stronger indicator of goalie performance than goals-against average and raw save percentage because it sets each goalie’s baseline relative to the difficulty of their environment. That way, keepers behind excellent teams aren’t unfairly rewarded for the strong defensive play in front of them, while goalies on poor teams aren’t punished for their team’s defensive problems. Jaroslav Halak playing 4.3 per cent above expectation is especially impressive, though all five goaltenders here are posting excellent results.
Looking at the expected save percentages in this group, we can see that Halak’s is the lowest, meaning he is working in a more difficult environment than the others. In fact, league wide, Halak has faced the second-most difficult environment among the top 40 goalies for shots faced, while his four competitors range from seventh to 29th-most difficult.
When considering the difficulty of a goaltender’s environment, one shot type that stands out is plays that cross the slot line. The slot line is an imaginary line extending straight out from the middle of the net to the top of the circles.
The ability to stop shots that come from passes and carries over the slot line would seem like a great indicator of a goaltender’s skill: your puck tracking, play reading, positioning, and push power are all tested when facing these most difficult shots. The data bears out this assumption nicely:
| GOALIE | SLOT LINE SV% | RANK |
|---|---|---|
| Robin Lehner | 0.833 | 1 |
| David Rittich | 0.825 | 2 |
| Jaroslav Halak | 0.806 | 4 |
| Carter Hutton | 0.796 | 5 |
| John Gibson | 0.672 | 22 |
The convergence between the overall top performers and the top slot line performers is strong, and Lehner and Rittich’s numbers, especially, are astounding. The exception to the otherwise far above-average group is noteworthy, however: Gibson lags way behind his four competitors, landing in the bottom third of NHL starters. He is obviously excellent in many areas, but when it comes to facing this kind of shot, he’s had limited success.
While plus/minus save percentage differential and slot line performance should be key statistics when deciding on the Vezina, sample size does have to be taken into account. Maintaining a great level of play over 20 games is difficult; doing it over 30 poses a greater challenge. Goals prevented above expectation makes this contribution clear:
| GOALIE | GP | GOALS PREVENTED | RANK |
|---|---|---|---|
| John Gibson | 33 | 27.7 | 1 |
| Jaroslav Halak | 22 | 24.8 | 2 |
| Carter Hutton | 27 | 20.5 | 3 |
| David Rittich | 22 | 18.2 | 4 |
| Robin Lehner | 18 | 13.9 | 12 |
Playing more games has its advantages. When you’re playing well, the positive impact you can have on your team is far more significant. Gibson’s lead atop the pack gives me more confidence that his performance can be sustained, whereas there is some question as to whether Halak, Rittich, and Lehner can maintain their high level of play over a full season. Carter Hutton, on nobody else’s radar for Vezina consideration, is perhaps the biggest surprise. He’s maintaining a very strong level of play over a relatively high number of games, suggesting that he’s been unfairly overlooked by pundits.
[relatedlinks]
The winner?
If you asked me to predict who will end up posting the best overall performance at the end of this season, I’d choose Gibson. He has strong numbers over many games, and while his slot line save percentage is low, he faces a low enough proportion of those shots that his total contribution should remain elite.
However.
Since we are choosing the top performer for the first half of the season, (for our purposes ending on Dec. 31), the nod has to go to Halak.
Facing the most difficult shots of the top-performing group and still leading his nearest rival by a full percentage point is no mean feat. His overall contribution to his team, measured in goals prevented above expectation, rivals Gibson’s in far fewer games played, and his slot line save percentage is elite.
You might object that Halak (as well as Rittich and Lehner) haven’t played enough games to really merit consideration, but even the NHL.com list paid little attention to this criterion: at the same point in the season, Vasilevskiy had played only 19 games, Rinne 28, and Andersen 30.
Halak earned it.
If you aim to award the top goaltender, you have to use the best data you have to evaluate the contenders, eschewing reputation and name recognition in favour of actual goalie-driven results.
Let’s hope the GMs who do the eventual Vezina voting are paying attention.