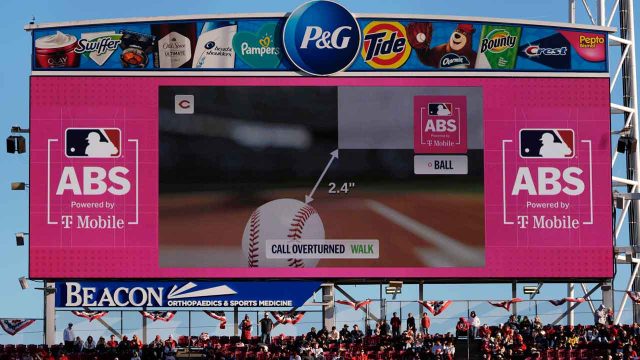
NEW YORK — Robot umpires overturned 54 per cent of challenged calls in the first season of the Automated Ball-Strike System, and catchers were far more successful than batters.
Learning when to challenge is key.
The Cincinnati Reds had a net gain of 16.8 runs, according to Baseball Savant calculations of total run value of overturns on challenges. The Los Angeles Angels were next at 14, followed by the Athletics (12.3) and Minnesota (10.1).
Cleveland was 30th at minus-13.4 and several other playoff teams rated poorly by that metric: the Los Angeles Dodgers (26th, -8.5), Tampa Bay (25th, -7.8), the Chicago Cubs (21st, -4.6), Milwaukee (20th, -2.4), Atlanta (18th, -2.1), San Diego (17th, -1.9), the New York Yankees (16th, -2.1) and Houston (15th, -0.8).
Houston's Jose Altuve topped batters with 5.6 projected runs gained, followed by Seattle's Cal Raleigh (4.6), Colorado's Kyle Karros (4.5) and Cincinnati's Sal Stewart (4.4) and JJ Bleday (4.1).
The Cubs' Seiya Suzuki led with 5.7 runs projected lost in defensive challenges, just ahead of the Dodgers' Shohei Ohtani (5.5), the Cubs' Ian Happ (5.2) and Michael Busch (5.1), and the New York Mets' Brett Baty (3.5).
Milwaukee’s William Contreras led catchers with 5.2 projected runs prevented, just in front of Cleveland's Patrick Bailey (5.1), the Mets' Francisco Alvarez (4.5) and San Diego's Freddy Fermin, Kansas City's Carter Jensen and Drew Romo of the Chicago White Sox (all 4.3).
“It’s like a new muscle for players to learn,” Yankees manager Aaron Boone said. “You have instincts over what to do in certain situations. This is a new instinct of knowing when to challenge and instinctively within a second, oh, that’s a ball. What’s the situation?”
There were 10,557 challenges, an average of 4.35 per game, and 5,686 led to overturned decisions.
Catchers succeeded on 59 per cent of their challenges, while batters had a 49 per cent success rate and pitchers — who seldom challenged compared to catchers and batters — were at 40 per cent.
“ABS has really impacted the game,” Houston manager Joe Espada said. “It has really changed how more selective some of these lineups are, how more disciplined they are, how we force pitchers to be more aggressive in the zone more than in the past.”
Contreras, Realmuto stand out among players
Contreras led all catchers with 185 challenges, and he also won the most with 105 (57 per cent). Meanwhile, Philadelphia's J.T. Realmuto had the highest success rate among catchers with at least 75 challenges at 81 per cent. He was followed by the Cubs’ Carson Kelly (69 per cent), Cincinnati’s Tyler Stephenson and Colorado’s Hunter Goodman (68 per cent each), and Detroit’s Dillon Dingler (66 per cent).
Realmuto added the first game-ending ABS challenge in post-season history this week, successfully flipping a call to end Game 2 of the Phillies' NL wild-card series against Atlanta.
The lowest percentages among those with 75 or more challenges were Alvarez (47 per cent), Fermin, Romo (48 per cent) and Edgar Quero of the White Sox (49 per cent).
Stewart led batter challenges with 51 appeals and won 28 (55 per cent). Philadelphia’s Bryce Harper was next with 47, winning 21 (45 per cent).
On success rate, Arizona’s Gabriel Moreno (68 per cent) led batters with 20 or more challenges, followed by Miami’s Esteury Ruiz (65 per cent), Raleigh (64 per cent), Minnesota’s Josh Bell and San Francisco’s Bryce Eldridge (62 per cent each).
Boston’s Ceddanne Rafaela and Colorado’s Willi Castro were at 25 per cent, the lowest success rate among players with at least 20 challenges.
Tampa Bay’s Yandy Díaz had 686 plate appearances without attempting a challenge, by far the most in the majors by a batter, ahead of Toronto’s Nathan Lukes (450). Díaz has said he’d consider challenging a call in the World Series.
Cincinnati's 62 per cent success rate led MLB, followed by the Athletics and Arizona (60 per cent each), the Cubs (59 per cent), Texas (58 per cent), Detroit and Philadelphia (57 per cent each) and Miami (56 per cent).
Pittsburgh was least successful at 47 per cent, with the White Sox and Cleveland at 49 per cent each, and Baltimore and San Diego at 50 per cent.
“We'll keep tweaking it, keep talking about it every day and keep trying to remind the players when we have challenges, when we don’t, when’s a good time, when’s not a good time,” Padres manager Craig Stammen said.
Players were more aggressive with ABS challenges in late innings
Knowing teams lose their right to challenge after two incorrect appeals, players used ABS less often early in games.
There were more challenges in the ninth than any other inning — sometimes because teams knew there would be no later innings to save them for — even though many games end without the bottom half. ABS was used in 1,366 ninth-inning challenges, with a 40 per cent success rate.
“Having one in your pocket is kind of — it’s nice to know you have it,” Phillies interim manager Don Mattingly said.
The average for innings 1-3 was 1,005 challenges with a 61 per cent success rate.
Teams also got more aggressive as the season went on. Challenges per game rose from 3.76 in March to 4.60 in August and 4.61 in September, with most of that increase in catcher appeals.
“You can overthink it if you let yourself,” Atlanta manager Walt Weiss said. “You start talking about saving it for certain situations, it probably doesn’t end well. My message was the lower the leverage, the more certainty you have to have.”
Overturn rate for umpires most often behind plate ranged from 42-66 per cent
Andy Fletcher had the highest overturn rate among umpires with more than 100 challenges, getting reversed on 80 of 121 (66.1 per cent), according to taptochallenge.com. Rob Drake was next at 64.6 per cent, followed by Cory Blaser (64.1 per cent), Adrian Johnson (64 per cent), Manny Gonzalez (62.5 per cent) and Mike Estabrook (61.7 per cent).
Jansen Visconti had the lowest overturn rate among those with triple-figure challenges, reversed on 43 of 102 (42.2 per cent). He was just ahead of Mark Ripperger (44.3 per cent), James Jean (44.9 per cent), Ryan Additon (45 per cent), Nestor Ceja (46 per cent) and Alex Tosi (46.9 per cent).
“When it gets overturned by less than a 10th of an inch, they do not like it,” Realmuto said of umpires. “When it’s that small, they don’t like it. That’s for sure.”
Video review success rate drops
Among video review used for other decisions such as safe/out calls, the 52.9 per cent success rate was down from 54.8 per cent in 2025 and 53.7 per cent in 2024 and up from 48.5 per cent in 2023.
There were 1,294 team challenges, an increase from 1,197 in 2025. Among the challenges this year, 243 calls were confirmed (18.8 per cent) and 367 were allowed to stand (28.4 per cent) when there was not clear and convincing evidence to overturn them. The average time of a review was 1 minute, 25 seconds.
Kansas City was the most successful club, overturning calls in 23 of 33 challenges (69.7 per cent). It was followed by Philadelphia (68.1 per cent), Cleveland (67.4 per cent), Milwaukee (65.9 per cent), Arizona (64.1 per cent), the Mets (62.5 per cent) and St. Louis (61.5 per cent).
San Francisco was the least successful, winning only 14 of 45 for 31.1 per cent. Texas was at 36.6 per cent and Pittsburgh at 38.6 per cent.
After initially starting video review in August 2008 for home run calls, MLB vastly expanded replays for the 2014 season.



 2:00
2:00