
If your social media feeds are anything like mine right now, they’re littered with data … data that many of us need explained to us like we’re five. With the U.S. presidential election still undecided (though it may be by the time you read this), there’s a lot to take in. Who voted for whom and by what percentage, how much of the vote is in, where in each state those votes come from — you get the idea.
Long story short: I’m seeing more “%” signs these days than I ever hoped I would after I completed my final college stats class with a letter grade that can be found in the word “passed” and wasn’t an “A.” (I blame hockey-related attendance issues.)
But stats don’t have to be exhausting — they can often be fun and illuminating — so I thought we’d stick to the theme of the day and look at some of those from the past NHL season, with the aim of keeping your eyes from glazing over. For example, did you know Quinn Hughes and Cale Makar finished first and second in rookie scoring, marking the first time in the modern era (since 1943-44) that defencemen held those ranks at the end of a season? No? Well now you do.
Shoutout to the folks at @SNStats, who are great at their jobs and who you should follow and probably Venmo money to (or just follow — your call), and who did literally all of the legwork on this stuff.
There will be zero themes to this whatsoever, beyond “hey, here are some cool stats to enjoy.” Need there be more to it than that?
1) The Edmonton Oilers had a franchise-record 29.5 PP%. It was over 4.2% better than the next-closest team this past season (Boston Bruins).
The Oilers also had the second-best penalty kill in the league, which is a pretty wild special-teams season. But yeah, they operated at an insane, nearly 30–per cent success rate over 71 games in 2019–20, obviously with peak Connor McDavid and Leon Draisaitl directing the traffic out there.
In another universe of hockey, the 1977-78 Montreal Canadiens put up a 31.88% success rate, while the 1976 New York Islanders eclipsed 30% as well. What the Oilers did on the PP this past season, though, at least in this iteration of NHL hockey, was staggering.
While we’re talking about the Oilers…
2) Draisaitl became just the second player in NHL history to lead the league in points (110) and have a minus rating (-7), joining Wayne Gretzky in 1993-94 (130 points, -25 rating).
This could be linked to the Oilers’ success on the power play, where Draisaitl had a league-high 44 power play points.
At this point we know the gig is pretty much up with plus/minus as a stat. We know it’s noisy; we know it’s greatly affected by team and teammate; we know it’s not much of a measure of an individual player.
Buuuuuuut…
If you had the best season in the league and won the Hart Trophy while playing on a team that nearly won its division, you’d expect your team to score more with you on the ice at even strength, would you not? For context, that rough Gretzky plus/minus year there, the Kings were awful — second last in their Division (only above the Oilers!) and third worst in their Conference. It’s a bit of a weird glitch with Draisaitl’s stats, is all, and maybe not nothing.
[relatedlinks]
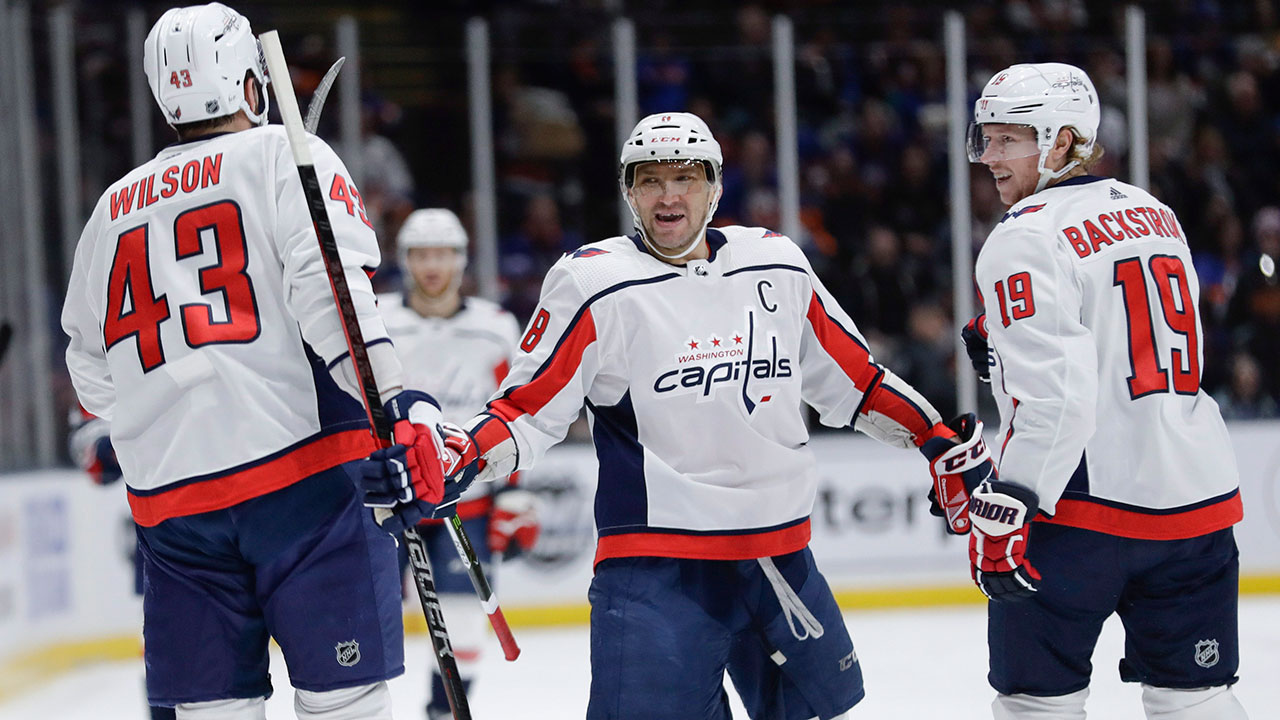
3) The Washington Capitals had the sixth-best PK% (82.6) … despite having the 11th-worst shorthanded SV% (.858).
In more conversational terms, only five team in hockey were better on the penalty kill than the Caps — even though they couldn’t get saves while short-handed. That’s pretty good! Is it possible that the way they killed penalties allowed for fewer chances but more dangerous ones? Sure. But I’d say it’s more likely that with some better goaltending, Washington would’ve been even better on the PK, which should be encouraging for Caps fans heading into next season.
4) It had been 58 years since the last season in which one player 23 or younger and another age 34 or older finished among the top two in goals (tied or outright). This past season saw David Pastrnak (age 23) and Alex Ovechkin (34) accomplish that feat. (Previous: Bobby Hull 23 and Gordie Howe 34 in 1961-62.)
“It’s a young man’s league,” we’re told … unless the “olds” in question are all-time greats.
Staying with goal scoring…
5) Pastrnak recorded four hat tricks this season after recording four in his first five seasons in the league.
Four hat tricks! He’s one of those guys who deserves NBA JAM “He’s heating up!”-style commentary every time he scores.
Also this past season:
6) Ovechkin recorded four hat tricks in a season for the first time in his career.
In conclusion, Pastrnak is a better goal-scorer than Ovechkin, and will inevitably lead the NHL in all-time goals scored.*
(*That is not a conclusion anyone on Earth would actually reach.)
7) Pastrnak scored the first goal of the game 15 times this season (seven more than any other player). The only player to ever score more first goals in a season was Brett Hull (19 in 1990-91 and 16 in 1991-92).
Sometimes stats like this look funny just by random chance and variance, particularly when a guy just flat-out scores a lot of goals. But I don’t think that’s the case here. I’ve seen some players who consistently come out strong and push for goals early (or just happen to be “on”), and either get energized by scoring (four hattys!), or go quiet when denied. Other players take a bit longer to get into the game — these are legit player traits.
There could be some defensive planning pulled from this – focus on him early, shut him down in the first, and avoid stoking those early embers. But against “The Perfection Line,” I’m guessing teams have tried the old “simply shut down Pastrnak” plan in the past to little success.
[snippet id=4167285]
8) Anton Khudobin led the NHL with a .930 SV% this season. His career SV% going into the season was .917.
First off, I didn’t realize his career save percentage heading into the season was that good, but yeah: The man earned himself that three-year contract extension. Enjoy that 10 shmill, chum.
9) There were 125 multi-goal comeback wins, the most in NHL history through 1,082 games (the amount of games played this season instead of 1,271).
This is my favourite stat here today because I came across some commentary this season about “hockey today” being less entertaining (less physical, too fast to follow, copycat styles), yet the game itself gave us great drama. The most multi-goal comeback wins EVER. When your team is down in today’s NHL, they aren’t necessarily out.
10) There were five instances of a team overcoming a deficit of 4+ goals to win a game, tied for the most ever in a single season (1983-84 and 1986-86).
Case in point! This is kind of a bonkers stat, ’cause it’s not like it’s just “came back to tie the score” or anything. These teams that were down four actually won their games. The league has to like that more focus on skill has led to a greater ability to bounce back in games than ever before.
While we’re entertaining ourselves looking at fun stats from the 2019-20 season, we welcome yours. Add them to the comments section below, and we can collectively compile a little virtual scrapbook from a super-weird season that gave us a few super-weird stats.
See? Stats aren’t ALL bad.