Yesterday we introduced projections for the Eastern Conference standings based on a combination of three analytical models (WAR, xGF% and Vukota) devised by different groups of analysts in the hockey community.
To reach our final projections, the standings predictions of the three models were averaged and the deviation of their rankings was determined to give a sense of how much they agree or disagree about where a team is likely to end up.
All three models agreed Tampa Bay is the team to beat in the East and that Buffalo and Toronto are likely to remain bottom feeders. They also all seemed to agree that, although the widely held perception is Washington has improved its chances this year, they may in fact end up as a bubble team.
In the Western Conference, there is much less alignment across the three different models than we found in the East, and much of this is tied in to what data is being used to create them. This becomes obvious when we look at the projected standings below:
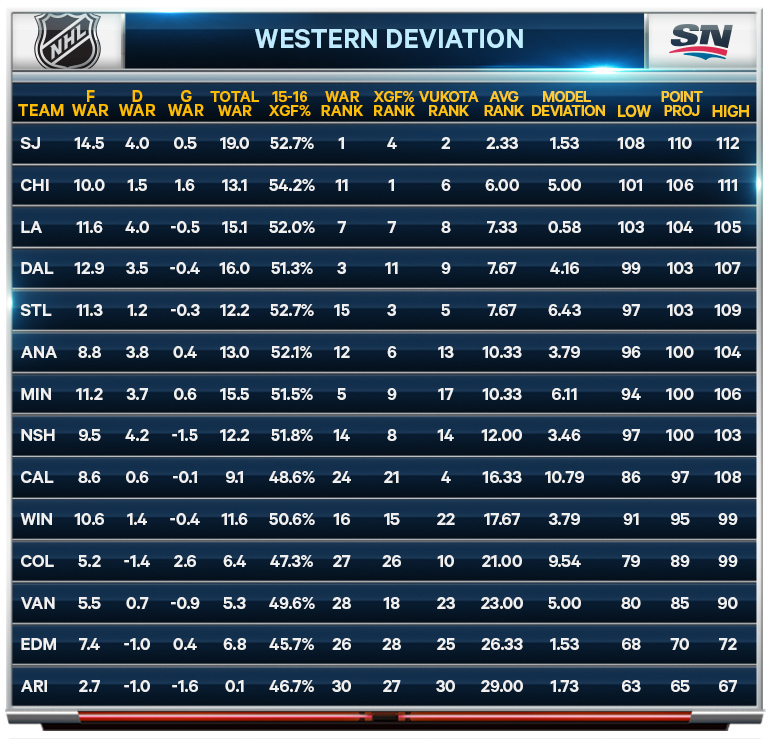
There are four teams in the Western Conference that have a ranking deviation across the three models of more than six – St. Louis, Minnesota, Calgary and Colorado. In the East, only the New Jersey Devils had this much disagreement. The reason why there is a lack of alignment around these teams actually gets to the heart of what each model values most in projections.
The war-on-ice.com Wins Above Replacement (WAR) model uses a combination of player data from prior seasons on shot attempt generation and suppression, penalty taking and drawing, faceoff and shooting skill, and goaltending in order to put a value on individual skaters. The skaters’ scores are then combined to reach a team projection for the coming season. Minnesota does very well by this metric, but drops in the xGF% and Vukota models due to ignoring goaltending (xGF%) and how goals are valued (Vukota).
xGF% uses data from prior seasons for expected goal production and prevention on the basis of shot location and type that are taken and allowed by each team at 5v5. Unfortunately, this ignores roster turnover, coaching changes, and takes goaltending out of the equation. But goaltenders are amazingly hard to predict year to year and it’s hard to know how individual skaters or coaches will impact a roster ahead of time, so this causes a significant degree of uncertainty.
St. Louis and New Jersey both rate high by this metric – largely due to their defensive prowess. It’s worth noting effective goal scoring is neglected a bit in this metric, and that’s something New Jersey struggles with. On the other side, the fact St. Louis has played in front of arguably replacement level goaltending for years is ignored.
Vukota is based upon Goals Versus Threshold (GVT), which is another form of Goals Above Replacement that focuses on allocation of responsibility on goals scored for or against while a skater is on the ice. GVT highly values the contributions of goaltenders and players with scoring skill because they are directly responsible for goal outcomes. This metric doesn’t highlight possession stats to the same degree as the other two models. Thus, teams like Calgary and Colorado, who have an abundance of “finishing” skill despite atrocious possession metrics, come out looking good in Vukota, but poor via WAR or xGF%.
One of the advantages of combining the three models is that it provides a dampening effect on possible over-exuberance of a single projection. While GVT seems very high on the Flames – suggesting they could finish in the top 5 of the entire NHL – the other models rein things in by reminding us that possession results and goaltending are likely to regress. In all likelihood Calgary will be a bubble team again as these competing features play out over the course of the season.
Whichever method you choose to apply when predicting the 2015-16 standings, puck drop is Wednesday and we’ll finally get to settle some of these debates.
Let’s get on with it, and may the best team win!
 On print and digital newsstands now: iOS | Android | Windows