Last year around this time I took a look at how misleading the NHL’s ‘giveaway’ statistic is for defencemen, and recently with Connor McDavid coming under fire for his turnovers, I revisited turnover statistics and looked at how to break them down to gain some valuable information.
The trouble with turnovers or giveaways as a statistic, especially in raw counts, is that they need to be given several levels of context in order to make a fair judgment.
How often is a player handling the puck? What zone is the player handling the puck in? How does the structure of the team the player plays on impact the success or failure rate of an attempted play? Does the system deployed by a player’s team lean on chips and dumps that result in more turnovers than passes and carries would? What’s the difficulty level of the plays a player makes with the puck? After all, it’s a lot easier to make a defence-to-defence pass than it is to find a forward in stride to clear the zone.
[snippet id=3317857]
All these questions have to be considered when looking at turnovers and not all of them have easy answers. One thing we can adjust for very easily is team structure, simply by comparing a player’s turnover rate to their teammates at the same position.
Usually when I graph turnover rates I invert the numbers so that positive percentages are good results, but for the sake of clarity let’s keep things normal here: a lower percentage equals a lower turnover rate, and a negative percentage means a player is turning the puck over less often than his teammates.
Looking at all regular forwards this season at even strength, we can compare their raw turnover rates to their turnover rates relative to their teammates.
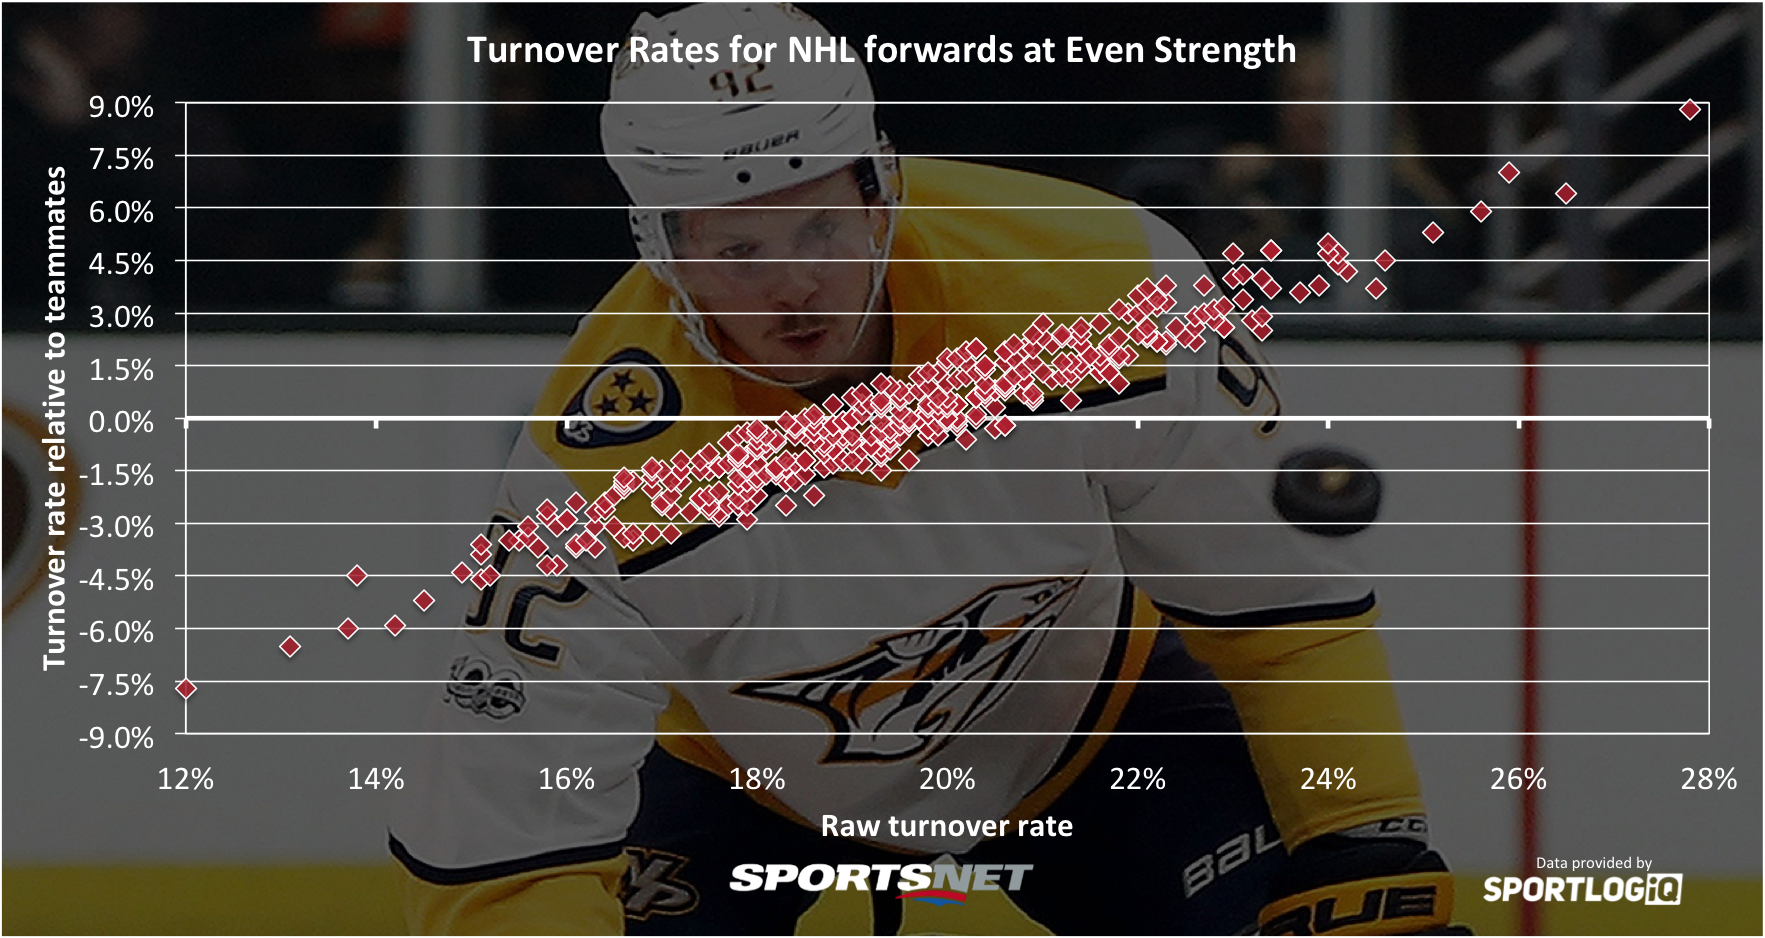
Ideally you would want to be in the lower left of the graph, with low overall and relative turnover rates. Most of the extreme outliers on both sides are players who don’t play a lot, which leads to smaller sample sizes and less reliable data.
Of all the NHL’s forwards so far this season 53.5 per cent are within plus or minus 1.5 per cent of their team’s average turnover rate, and 83.7 per cent are within plus or minus 3 per cent of their team’s average. The remaining players outside that mid-range zone who still play significant minutes are interesting cases, but even while looking at the extremes in relative turnover rate, we can’t really make a reliable value judgment on whether a player is especially risky or especially safe.
For example, forwards commit a vast majority of their turnovers in the offensive zone. Enemy territory is where forwards are more likely to take risks and since they handle the puck there far more often, this is a natural occurrence. A turnover in the offensive zone might not be ideal, but it doesn’t carry the same risk as one in the neutral zone, or especially in the defensive zone.
As an illustration, let’s look at five of the best turnover rates relative to teammates in the NHL, and five of the worst, then break them down by zone.
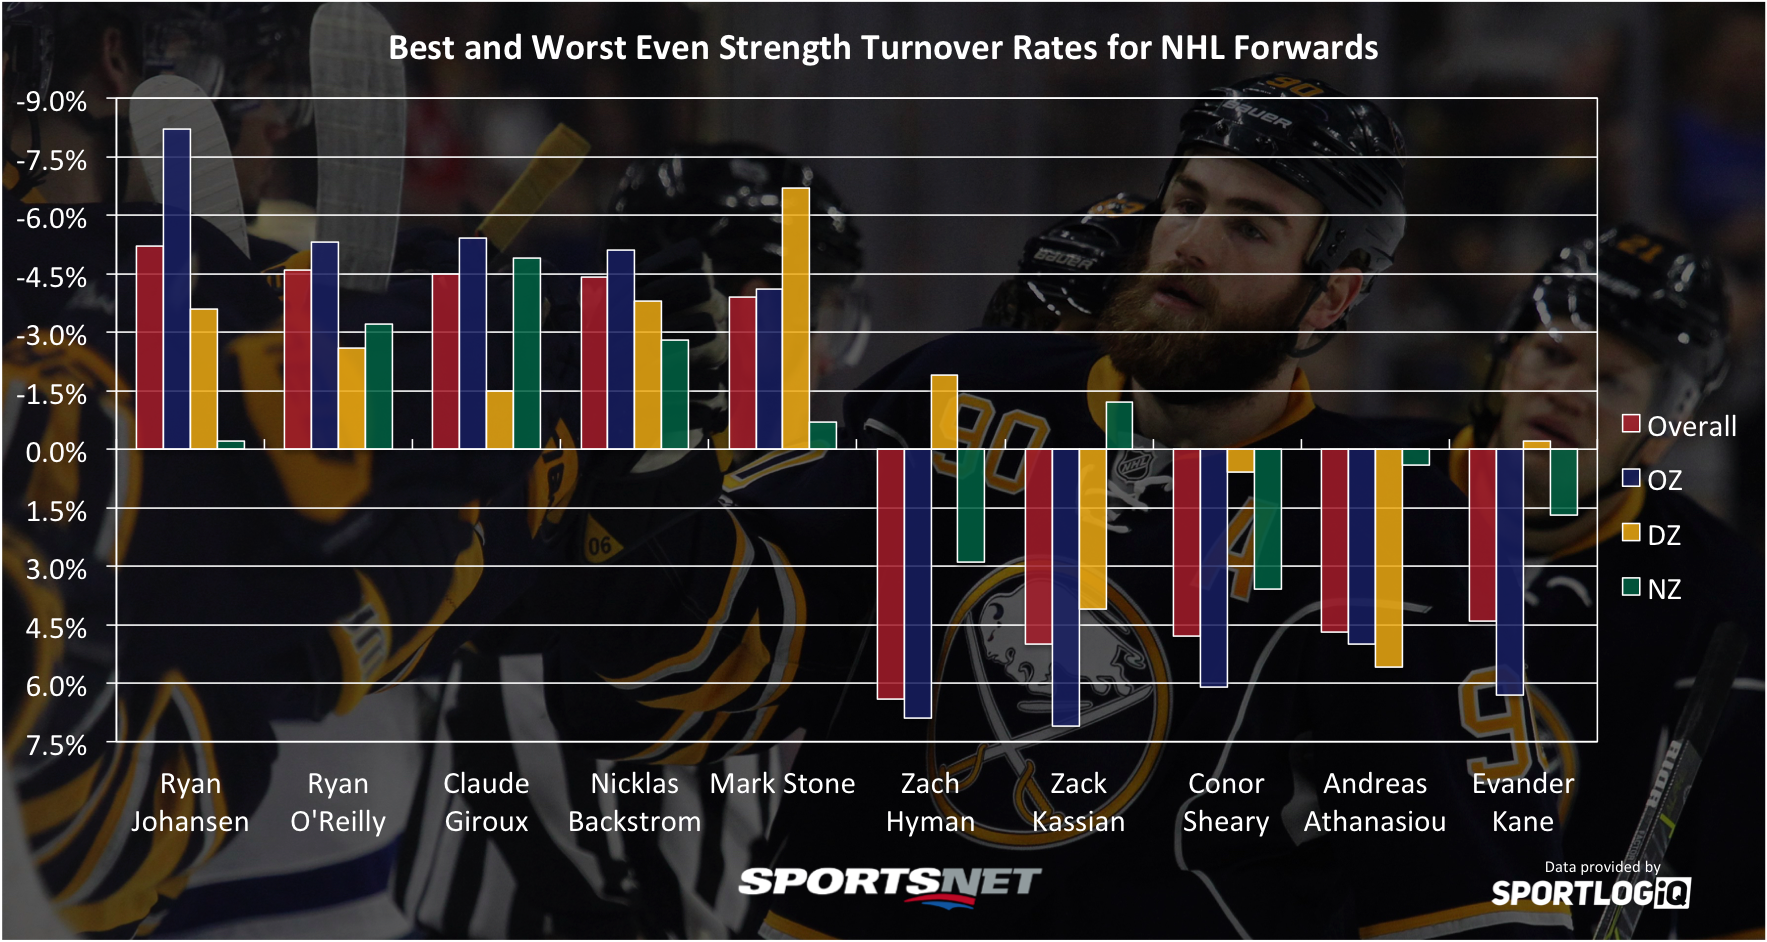
Note that negative relative numbers are still good here (less turnovers relative to their team), but I’ve inverted the vertical-axis so the bars above the horizontal-axis show good results.
One thing that pops out here is that all of the top-five players are high-level playmakers, and they’re not players who sit on the sidelines making safe plays. These are big-time even strength producers who touch the puck a lot.
Having a strong relative turnover rate overall doesn’t necessarily mean a player’s puck management is risk free, though. Each zone on the ice presents its own challenges. Ryan Johansen is a wizard in the offensive zone, where he almost never gives the puck up, but in the neutral zone he’s essentially average.
Mark Stone has a completely different profile than his peers, with his biggest strength being in the defensive zone. Could we then say that despite Stone having a weaker relative turnover rate than Johansen by 1.2 per cent overall, that Stone’s plays are actually safer? I would say there’s a very good chance.
The players on the poor end of the scale are a bit more varied, with some middle-six forwards of various degrees of talent and Evander Kane, who is having a career year in Buffalo.
[snippet id=3638287]
Kane is an interesting case as well, because while his high relative turnover rate might make you think he’s a big risk taker, he’s actually better than team average by a hair in the defensive zone, and not absolutely horrible in the neutral zone. Where Kane’s problem occurs is he takes many risks in the offensive zone to create chances, and he rarely touches the puck outside the offensive zone.
Considering Kane has 23 points in 25 games for the goal-starved Sabres, they’re probably OK with him pushing plays aggressively in the offensive zone.
On the opposite side of the spectrum we have Andreas Athanasiou, who is getting more trust this year from the coaching staff, but remains a big problem in the defensive zone. However, once he gets into the neutral zone, he’s close to team average, and creates a lot using his speed through the middle.
Then you’ve got a player like Zach Hyman, who is legitimately strong in the defensive zone, but struggles outside it and ends up with the third-worst relative turnover rate in the NHL among forwards. Is Hyman risky? Not in the traditional sense. He’s not going to cause a bunch of goals against, but his high turnover rates in the neutral and offensive zones do hinder transition and offensive opportunities for his linemates – so much so that it may outweigh his vaunted forechecking ability.
Even with a couple of layers of context here I don’t think we’re at a point of great confidence with turnover statistics. Adjusting for difficulty of plays attempted is an obvious next step, but balance matters as well. If a defenceman only ever makes stretch passes and is better than average at them, they’ll still end up with tons of turnovers. Should that player be seen as risky, or rewarded for making high-impact plays at a high rate? There’s no easy answer here, and it likely varies depending on whom you’re asking, even at the coaching level.
The more information we have the more successfully we can peel back the curtain on what matters in hockey, but there will always be some subjective judgments.
Hopefully, as we add context to turnovers, there’s a bit less of them.
[relatedlinks]