

One of the biggest gaps in player analysis between the NHL and junior and minor leagues is the massive absence of available data that can be vetted publicly. Despite that challenge, quality insights can and have been made. And as NHL teams slowly adjust to the analytical insights provided by large-scale aggregation of scouting information, a more thorough process of vetting talent ahead of the draft emerges.
Work has been done in a variety of areas to assess the value of prospects based on the performance of players picked in the past, but much of that revolves around simple counting stats—goals, assists, points—in combination with physical information about prospects—height, weight, etc. At the NHL level, the league keeps relatively detailed information on player ice time, shot-attempt locations and types, and which players are present on ice for every event that takes place. In contrast, junior-hockey data revolves mainly around goal events in an absence of ice time.

Falling in many draft rankings, Erie’s Alex DeBrincat has one of the best shots at translating his goal-scoring success to the NHL. (Terry Wilson/OHL Images)
Slowly, though, progress is being made. The appetite for junior programs to incorporate their own analytics has been shown in recent years as a number of teams across the CHL have brought on analysts in an effort to improve their performance and player development. Additionally, the leagues themselves are improving the data they are making publicly available. The QMJHL took the lead in recent years, adding in shot and “dangerous” shot data to its traditional offerings, letting outside observers see which shooters are producing scoring chances at an increased rate.
This year, the OHL made a significant step in the right direction when it added shot location to the Play-by-Play files available on its redesigned website. While it is only one season of data, we can already pull loads of interesting insights from what is being tracked.
One thing that becomes glaringly obvious—and NHL teams are certainly aware of it—is how massive the gap is between junior-level defences and goaltending, and what players will face in the professional ranks. War-On-Ice devised a filtering system for various shots based on location data, identifying them as High, Medium or Low Danger based on the proportion that end as goals from various regions of the ice.
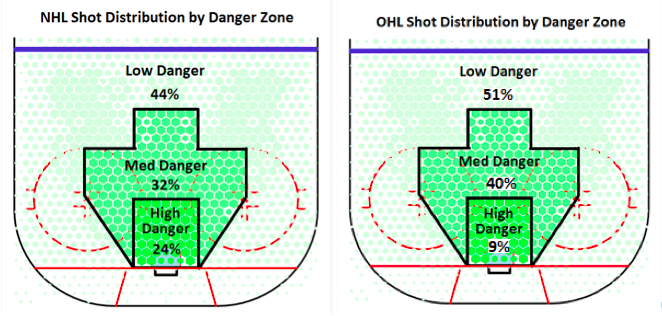
If we look at the distribution of shots on goal at the OHL level in comparison to the NHL, we see significant differences. OHL shooters have a much higher tendency to shoot from longer distances, largely because it’s easier to score from further out on the inferior goaltending at the junior level. This is easily shown by comparing the League Average Save Percentages by Danger Zone at the two levels for this past season.
| Danger Zone | NHL Avg. SV% | OHL Avg. SV% |
|---|---|---|
| LD | .980 | .931 |
| MD | .960 | .835 |
| HD | .907 | .739 |
Shooting on OHL goaltenders from bad angles and long distance is more likely to result in a goal than shooting on NHL goaltenders from the Medium Danger area. Throwing anything and everything on net in junior is a worthwhile exercise, and for some players this lends itself to being productive despite rarely shooting from higher traffic areas.
To adjust for this effect, we can weight shot attempts from each of the three regions in junior by their relative value in comparison to the NHL. By translating OHL results to comparable NHL results, we can get a sense just how steep the drop off is from one league to the other.
| OHL Data | NHL Equivalent | ||||||||
|---|---|---|---|---|---|---|---|---|---|
| Player | Shots | HD SH% | MD SH% | LD SH% | Goals | HD SH% | MD SH% | LD SH% | Goals |
| Christian Dvorak, LDN | 192 | 42.50% | 24.30% | 20.00% | 52 | 17.63% | 6.75% | 7.57% | 18 |
| *Alex DeBrincat, ER | 269 | 35.00% | 21.10% | 13.10% | 51 | 14.52% | 5.87% | 4.96% | 17 |
| Dylan Sadowy, SAG/BAR | 232 | 37.70% | 14.10% | 11.10% | 45 | 15.64% | 3.93% | 4.21% | 16 |
| Andrew Mangiapane, BAR | 213 | 22.00% | 29.10% | 13.30% | 52 | 9.11% | 8.10% | 5.05% | 16 |
| Mike Amadio, NB | 249 | 27.80% | 25.20% | 12.00% | 50 | 11.52% | 7.00% | 4.54% | 16 |
| Zachary Senyshyn, SSM | 263 | 17.30% | 22.40% | 9.30% | 45 | 7.18% | 6.23% | 3.52% | 15 |
| Spencer Watson, KGN | 353 | 32.40% | 12.80% | 6.10% | 43 | 13.42% | 3.55% | 2.31% | 14 |
| Aaron Berisha, MIS | 194 | 50.00% | 29.60% | 8.30% | 45 | 20.74% | 8.24% | 3.16% | 14 |
| Greg Betzold, PBO | 249 | 22.20% | 20.20% | 11.20% | 43 | 9.22% | 5.60% | 4.26% | 14 |
| Christian Fischer, WSR | 266 | 20.00% | 15.10% | 12.60% | 40 | 8.30% | 4.20% | 4.79% | 13 |
| Ryan MacInnis, KIT | 243 | 24.20% | 13.40% | 15.40% | 38 | 10.06% | 3.74% | 5.83% | 13 |
| Hunter Garlent, PBO | 269 | 19.40% | 19.70% | 8.60% | 40 | 8.03% | 5.47% | 3.27% | 13 |
| Kevin Labanc, BAR | 252 | 34.30% | 17.80% | 5.10% | 38 | 14.22% | 4.95% | 1.91% | 13 |
| Mitchell Marner, LDN | 227 | 26.10% | 21.40% | 9.20% | 39 | 10.82% | 5.94% | 3.48% | 12 |
| *Adam Mascherin, KIT | 258 | 20.00% | 14.30% | 12.30% | 36 | 8.30% | 3.97% | 4.65% | 12 |
| Dylan Strome, ER | 229 | 34.60% | 18.50% | 6.30% | 37 | 14.36% | 5.16% | 2.40% | 12 |
| Dante Salituro, OTT | 245 | 24.00% | 16.70% | 9.40% | 38 | 9.96% | 4.63% | 3.55% | 12 |
| Michael Dal Colle, KGN | 251 | 28.00% | 21.60% | 2.00% | 36 | 11.62% | 6.00% | 0.75% | 11 |
| Mathew Santos, NB | 196 | 44.40% | 12.30% | 9.10% | 30 | 18.44% | 3.43% | 3.44% | 11 |
| Jordan Maletta, NIA | 197 | 19.40% | 25.60% | 6.60% | 34 | 8.03% | 7.10% | 2.49% | 11 |
| Brendan Lemieux, BAR/WSR | 217 | 23.10% | 19.40% | 7.50% | 32 | 9.57% | 5.39% | 2.85% | 10 |
| Matt Mistele, OSH/SAR | 230 | 22.70% | 20.70% | 5.20% | 33 | 9.43% | 5.76% | 1.95% | 10 |
| *Matthew Tkachuk, LDN | 191 | 22.90% | 14.30% | 13.60% | 30 | 9.48% | 3.97% | 5.16% | 10 |
| JJ Piccinich, LDN | 160 | 40.00% | 17.70% | 7.70% | 30 | 16.59% | 4.92% | 2.91% | 10 |
| Travis Konecny, OTT/SAR | 240 | 16.70% | 10.60% | 12.90% | 29 | 6.91% | 2.94% | 4.89% | 10 |
| *Max Jones, LDN | 192 | 28.10% | 17.50% | 7.50% | 29 | 11.67% | 4.86% | 2.84% | 10 |
| Justin Scott, BAR | 200 | 35.10% | 11.70% | 3.80% | 28 | 14.58% | 3.26% | 1.46% | 10 |
| *Dmitry Sokolov, SBY | 231 | 26.30% | 16.10% | 7.00% | 30 | 10.92% | 4.47% | 2.65% | 10 |
| Aaron Luchuk, WSR | 168 | 34.50% | 12.50% | 11.90% | 27 | 14.31% | 3.47% | 4.52% | 10 |
| *Kyle Maksimovich, ER | 153 | 45.50% | 15.10% | 10.30% | 27 | 18.86% | 4.19% | 3.92% | 9 |
| *Will Bitten, FLNT | 143 | 29.20% | 20.60% | 13.70% | 28 | 12.10% | 5.72% | 5.20% | 9 |
| Pavel Zacha, SAR | 163 | 26.70% | 14.60% | 18.60% | 28 | 11.06% | 4.06% | 7.06% | 9 |
| Jeremiah Addison, OTT | 179 | 36.70% | 14.20% | 2.30% | 27 | 15.21% | 3.93% | 0.88% | 9 |
| Trent Fox, HAM | 202 | 17.20% | 20.20% | 6.70% | 28 | 7.15% | 5.62% | 2.55% | 9 |
| *2016 NHL Draft eligible |
London’s Christian Dvorak led the OHL in goals per game this season at 0.881 and is the leader among the league’s shooters heading into his professional career with Arizona after this season. Two-time 51-goal scorer Erie’s Alex DeBrincat presents an interesting case of an undersized forward who shows legitimate elite shooting talent. It will be interesting to see where he lands in the NHL Draft and how his career trends. Michael Amadio’s excellent numbers this year with North Bay look likely to translate well into the pro game in the L.A. Kings developmental system.
Elite producers like Mitch Marner, Dylan Strome, Michael Dal Colle and Travis Konecny fall a bit further down the list than might be expected. They will take some time to recognize that a lot of what they’ve gotten away with in junior won’t work as effectively in the NHL, an adjustment that is part of the natural transition to the next level.

Marner’s highlight-reel plays aside, he’ll have some adjustments to make in the NHL. (Terry Wilson/OHL Images)
The skaters we would see as the most comfortable in transitioning to the pro game are those who are most comfortable shooting from high traffic areas in junior. Interestingly, only 30 OHLers managed to fire 30 or more shots from the High Danger zone, and only three of those scored fewer than 20 goals. Seven of them are eligible for June’s NHL Draft: Matthew Tkachuk and Max Jones of London, Michael McLeod and Nathan Bastian of Mississauga, Windsor’s Logan Brown, Erie’s Taylor Raddysh and Flint’s Nicholas Caamano. Of that group, Tkachuk and Jones ranked highest in NHL Equivalent Goals based on their shot distribution and shooting percentages.
The lesson
Don’t be deceived by highlight reels and gaudy scoring numbers in the CHL. As we get more data on junior-league skaters, projecting players at the NHL level will become clearer. We are still in the early stages of a data-driven exploration of player valuation in hockey, but over time the depth will only continue to grow and with it the ability to better draft and develop pro players.