Using statistical analysis to break down the best players at centre, right wing, left wing, and defence is one thing, but it things get a little more hazy when it comes to goaltending. Forwards and defencemen do a lot of different things that are fairly simple to track; they shoot, they pass, they hit, they carry the puck, they lose the puck. Goaltenders save shots, sometimes they make passes or freeze the puck for a faceoff, but for the most part what they do is react to skaters, in ways that aren’t easily tracked.
How quickly a goaltender moves laterally is not easy to isolate, nor is how well they telescope out to cut down angles. Much of their success is also based on the teammates in front of them. The best goaltender in the world will be lit up if their defenders allow countless backdoor passes or breakaways.
Last year I reached out to Chris Boyle of the Shot Quality Project and Paul Campbell of InGoal Magazine for help in breaking down how to measure a goaltender’s effectiveness, and based on what kind of data we have available, I think that formula holds up well, though I made some changes this year.
Instead of simply giving a score for difficulty of shots faced, I used a multiplier like I have been doing for skaters this year, with a maximum of 1.25 if a goaltender were to face the toughest kind of shots in every category measured. The actual score for the goaltenders will be from the performance (70 possible points) and consistency (30 possible points) categories.
To be considered for this list, a goaltender has to have started in a minimum of 75 games over the past three seasons, though I made an exception for Matt Murray, who has played enough in the playoffs that I felt ok including him. 42 goaltenders qualified for the rankings. Statistics were collected from Hockey Reference, NHL.com, Corsica.Hockey, and Sportlogiq.
Here are the statistics used in each category:
For performance: 5-vs-5 save percentage, powerplay save percentage, shorthanded save percentage, Inner slot save percentage, rebound percentage, rebound into the slot percentage.
For consistency: Quality start percentage, percentage of available games started, and really bad start percentage (save percentage below .850).
For difficulty: 5-vs-5 scoring chances against, special teams scoring chances against, 5-vs-5 high danger scoring chances against, special teams high danger scoring chances against, high danger passes preceding shots against (slot passes, passes off the rush, and east-west passes below the tops of the faceoff circles), rebound loose puck recovery rate in the slot, rebound loose puck recovery rate in the inner slot, and Corsica’s expected save percentage.
[relatedlinks]
23. Jake Allen
Difficulty Matrix: 1.099/1.25
Performance: 44.73/70 | Consistency 16.42/30
Total: 61.15/100

After some struggle to establish himself as a legitimate starting goaltender in the NHL, Allen finally had a chance to consistently grab the reigns last season. After struggling to begin the year, he flourished after Mike Yeo took over as head coach, and was the biggest reason the Blues upset the Wild in the first round of the playoffs.
The Blues are a strong defensive team and don’t force Allen into tough situations often, and in order to take the next step and establish himself as a top-end goalie, he’s going to have to cut down on his blow up starts. Allen has high peaks and disastrous lows, making it tough for his team to rely on him consistently.
22. Tuukka Rask
Difficulty Matrix: 1.093/1.25
Performance: 42.72/70 | Consistency 19.31/30
Total: 62.03/100

For a long time Tuukka Rask was the model of consistency behind the vaunted Claude Julien defensive system. That system has stayed in place, though with the quality of defensemen employing it, maybe it wasn’t as effective as numbers show, because Rask has been average for two straight seasons.
Whether that’s due to some lingering injuries or Zdeno Chara closing in on 40, personally I doubt that Rask is simply an average goaltender these days. One trouble spot for him though, is that he had a ton of blow up games last season, in fact no goaltender had more. That’s not the Rask we all know.
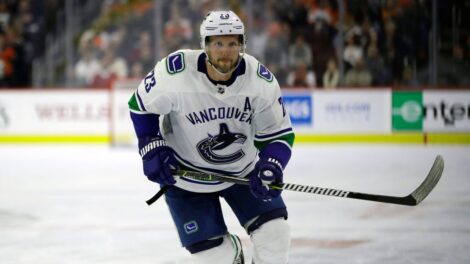
21. Ryan Miller
Difficulty Matrix: 1.189/1.25
Performance: 44.76/70 | Consistency 17.73/30
Total: 62.49/100

Spending his mid-30’s on a floundering Vancouver Canucks team that hasn’t been able to figure out if it’s tanking or gunning for a playoff spot, Miller has faced the second-highest quality shots against in the league.
His results have been around league average, which is actually quite strong, but he’s struggled a fair amount with consistency as age has robbed a bit of his former lightning speed from him. Miller is still a very good goalie, but he’s nowhere close to his prime.
20. Mike Smith
Difficulty Matrix: 1.191/1.25
Performance: 45.98/70 | Consistency 16.97/30
Total: 62.95/100

The Flames’ new goaltender doesn’t have a flashy save percentage to point to coming out of Arizona, but his league average numbers look a lot better when you factor in that he faced the toughest shots of any goaltender in the NHL for the last three years.
Smith has struggled to put up quality starts, but that is mostly due to dealing with those tough shots, and he’s been pretty good at avoiding really bad starts over that time. Smith is a bit too reliant on his size at times, and can get himself into trouble with his overly aggressive puckhandling, even though he’s generally a good puckhandler. He may not reach epic heights, but he doesn’t bottom out much either.
19. Robin Lehner
Difficulty Matrix: 1.128/1.25
Performance: 44.71/70 | Consistency 18.26/30
Total: 62.96/100

The biggest enemy Robin Lehner has is himself, as he has the talent to be a top-15 goaltender, but he gets in his own head often, getting rattled by bad goals or ones he thinks shouldn’t count. He’s improving there, but he’s got a ways to go if the Sabres want to make the playoffs.
18. Martin Jones
Difficulty Matrix: 1.111/1.25
Performance: 44.59/70 | Consistency 18.72/30
Total: 63.31/100

After a strong first season in San Jose, Jones struggled to reach the same performance heights in his second season as a starting goaltender, but at the same time, he very rarely cost the Sharks games. Last season he was one of the most consistent goaltenders in the league, giving the Sharks tons of quality starts and not many rough ones.
17. John Gibson
Difficulty Matrix: 1.083/1.25
Performance: 44.76/70 | Consistency 20.20/30
Total: 64.96/100

Long heralded as a star goaltender in the making, Gibson’s athleticism often did him no favours as he was breaking into the NHL, leading to him overshooting on cross-ice chances and losing his net often. Last year however, he found his game and did so consistently.
Gibson benefits from a strong defensive system in Anaheim, but the quality of the shots he faced went up last year with the incoming of Randy Carlyle’s system replacing Bruce Boudreau’s. Yet, he broke out and had a career year, hinting that maybe it’s the start of something special.
[snippet id=3637277]
16. Jonathan Quick
Difficulty Matrix: 1.031/1.25
Performance: 45.37/70 | Consistency 20.93/30
Total: 66.29/100

No goaltender in the NHL faces lower quality shots than Jonathan Quick does. His shots come from much further away from the net, and very rarely involve pre-shot movement under Darryl Sutter’s choking defensive system.
That setup works perfectly with Quick’s style, which is overly aggressive on angles, leading him far out of the net and unable to recover on rebound chances, but the Kings mop those rebounds up better than anyone else. Quick’s athleticism is a strength and weakness, as he can make unstoppable shots hit him, but also turn routine shots into grade-A second chances.
15. Ben Bishop
Difficulty Matrix: 1.074/1.25
Performance: 48.03/70 | Consistency 18.38/30
Total: 66.40/100

Big Ben Bishop had an extremely inconsistent year, as he was bested in Tampa Bay by Andrei Vasilevskiy, and couldn’t seem to get into a groove without consistent starts, leading to a huge drop in quality start percentage.
Bishop is fairly strong laterally for a large goaltender, but at 30-years-old, turning 31 in November, you may seem some slowing that could expose holes in his game in the next couple years.
14. Roberto Luongo
Difficulty Matrix: 1.118/1.25
Performance: 45.57/70 | Consistency 20.86/30
Total: 66.43/100

At 38-years-old this season, injuries and age are starting to take their toll on Roberto Luongo’s ability to be a top goaltender. And yet, he only moved down one spot from last year even after missing a large portion of the season.
Luongo has a reputation for being in blow up games, and he’ll make fun of himself on twitter for it, but the truth is he rarely has those games, leading to him being a pretty consistent player who’s closing in on 1000 games this season. Luongo’s even strength save percentage was rough last night, but he was incredible on special teams, and boasted one of the best high danger save percentages in the NHL, perhaps a sign that he’s not done yet.
13. Brian Elliott
Difficulty Matrix: 1.114/1.25
Performance: 47.43/70 | Consistency 19.98/30
Total: 67.41/100

It really didn’t work out for Brian Elliott in Calgary, but he wasn’t as bad as the perception around his season had people believing. The problem with Elliott has always been the same; he’s either brilliant or terrible, with few games in between. When he’s terrible for a few games in a row, say in the playoffs, that will define him for that year because it’s all people remember.
12. Devan Dubnyk
Difficulty Matrix: 1.050/1.25
Performance: 48.54/70 | Consistency 19.08/30
Total: 67.62/100

Dubnyk seems to alternate good and average seasons, and last season was a strong one behind a great defensive scheme in Minnesota. Bruce Boudreau’s system has helped Dubnyk reclaim some of the magic of his first season with the Wild.
Facing among the easiest shot quality in the NHL over the last three seasons, it’s tough to know how much of the high level of play is talent from Dubnyk, but when teams do get high end chances he still shines, as last year he led all goalies in save percentage from the inner slot.
11. Thomas Greiss
Difficulty Matrix: 1.145/1.25
Performance: 51.07/70 | Consistency 16.66/30
Total: 67.73/100

In his first year as sole starting goaltender, Greiss traded a high level of performance for more consistency. He gave the Islanders an extremely high rate of quality starts, but he didn’t steal many games, and the games where he wasn’t giving quality were often really bad starts. It remains to be seen whether Greiss can keep up a higher level of play while getting a majority of starts, but his history suggests that he should be able to.
[snippet id=3638287]
10. Cory Schneider
Difficulty Matrix: 1.118/1.25
Performance: 48.06/70 | Consistency 21.24/30
Total: 69.30/100

Off-season surgery seemed to really derail Cory Schneider’s last season, as he never hit his usual level of performance. Schneider has typically been among the best goaltenders in the league. Schneider is too sound technically to have another season like that, so I fully expect him to jump back up next season.
9. Henrik Lundqvist
Difficulty Matrix: 1.152/1.25
Performance: 45.76/70 | Consistency 24.29/30
Total: 70.05/100

For the first time in eight seasons Henrik Lundqvist registered a save percentage below .920, as he struggled with more blow up starts than we’re used to seeing from him. The Rangers don’t do him any favours either, as he faces among the toughest shots in the league behind a fairly porous blueline. The Rangers have retooled there pretty well though, so don’t be surprised if the old King Henrik is back next season.
8. Frederik Andersen
Difficulty Matrix: 1.101/1.25
Performance: 48.28/70 | Consistency 23.19/30
Total: 71.47/100

It may not have looked that impressive at times, but while setting a career high in games played, Frederik Andersen had the best season of his career while facing tougher shots than he ever has before.
Andersen may not have stolen many games for the high flying, defensively porous Maple Leafs, but he gave them a consistent baseline that was above league average and rarely got run out of the building. If the Leafs were a bit stronger defensively, we’d likely view Andersen’s last season in the .922 save percentage territory, or even higher.
7. Craig Anderson
Difficulty Matrix: 1.101/1.25
Performance: 54.70/70 | Consistency 18.60/30
Total: 73.30/100

It’s hard to imagine more mental toughness in an athlete than what Craig Anderson displayed last year, taking time off to be with his wife Nicholle as she battled cancer, Anderson put up excellent numbers and was a key to an overachieving year for the Senators.
Anderson struggled on special teams last season, which hid how truly dominant he was at even strength, with the second-highest inner slot save percentage.
6. Cam Talbot
Difficulty Matrix: 1.135/1.25
Performance: 54.25/70 | Consistency 20.56/30
Total: 74.81/100

Behind the high flying Oilers, Cam Talbot has the tough job of holding things steady on a back end that could use some work. The quality of shots Talbot faces did drop a bit from the year before, but he was also called upon to play 73 regular season games.
In those 73 games, Talbot was a model of consistency; with a high rate of quality starts and not many really bad ones. That’s tough to do when you don’t get a rest.
5. Corey Crawford
Difficulty Matrix: 1.118/1.25
Performance: 52.35/70 | Consistency 23.94/30
Total: 76.29/100

Over the previous three years Corey Crawford was the most consistent goalie in the NHL, but as the Blackhawks have started to show warts after years of retooling on the fly, Crawford finally had a season where he struggled to be a difference maker.
The Blackhawks actually improved defensively last season, and Crawford’s numbers were fine overall, but he went from a league leader to simply average in quality starts.
4. Braden Holtby
Difficulty Matrix: 1.077/1.25
Performance: 53.59/70 | Consistency 23.70/30
Total: 77.29/100

A Vezina nominee and the winner the year before, Holtby was arguably better this past season in losing the Vezina than he was the season he won it. Holtby faces a relatively easy workload due to the Capitals’ strong defensive system, but he gives them a lot to work with.
Holtby’s even strength save percentage has been stellar, and his level of performance has been astoundingly consistent, giving the Capitals the confidence to take risks when they need to and win more games.
[snippet id=3317857]
3. Sergei Bobrovsky
Difficulty Matrix: 1.125/1.25
Performance: 54.38/70 | Consistency 25.04/30
Total: 79.43/100

After a couple down years dealing with injuries and a team in disarray, Sergei Bobrovsky returned to the form that won him the Vezina Trophy in 2012-13, winning it once again with a stellar season in Columbus.
Bobrovsky led the NHL in even strength save percentage, and led all starting goaltenders in quality start percentage. The challenge now will be attempting to repeat it on a Blue Jackets team with expectations.
2. Matt Murray
Difficulty Matrix: 1.082/1.25
Performance: 60.70/70 | Consistency 22.10/30
Total: 82.80/100

The young phenom has won two Stanley Cups before even hitting 100 games played. There’s a huge caveat to Murray’s ranking since we just don’t know for sure if he can maintain this level of performance, but what he’s shown in the NHL so far has been brilliant.
Murray doesn’t face the toughest of shots in Pittsburgh, a team continually trying new things to dominate the high danger scoring chance game, but this year in the Stanley Cup Final he was obviously the difference maker.
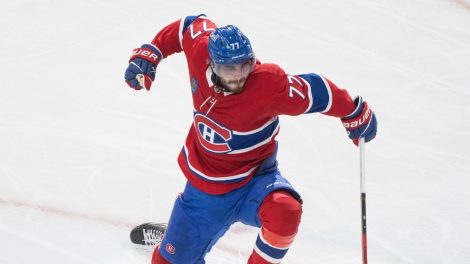
1. Carey Price
Difficulty Matrix: 1.132/1.25
Performance: 67.60/70 | Consistency 28.06/30
Total: 95.66/100

The same number one as last year, you know a player is special when a so-called off year results in a Vezina nomination. Price has cemented himself so solidly on the number one spot that pundits just expect him to win the Vezina as long as he’s healthy.
Price is the smoothest operator in the NHL, making goaltending look effortless and saves look easy with superior positioning, anticipation, and economy of movement. When he needs to make a desperation save, he can be as explosive and athletic as anyone, but he rarely needs to because he’s so efficient.