Now that we’re a month into the season and each team has played out roughly one-fifth of their 82-game schedule, we’ve reached an interesting crossroads. With certain teams either under or over-performing the expectations we had for them heading into the year, it’s up to us to figure out which performances we should believe, and which ones we should be skeptical of.
As a hockey community we go through this same dance every year around this time. The difficulty with trying to discern what’s real and what’s not is only compounded by hockey’s relatively unpredictable nature. The sport opens itself up to all sorts of chance and randomness at the whim of a bouncing puck, which makes it easy to be deceived by the results in such small samples.
Fortunately for us, by now we’ve figured out that there are certain underlying markers to look for when sorting through the mound of early-season numbers that’ve been accumulating. Of particular interest to us are the trends that we can reasonably expect to continue over time. We’re looking for things that theoretically denote a sustainable performance rather than an opportunistic one, so that we’re appropriately lauding and criticizing where it’s warranted and not just chasing our own tails.
To see this distinction in practice, here’s a comparison of how well a given team’s early-season shot and goal differentials – using the 20-game mark as a threshold – predict that team’s totals for the remainder of the season (i.e. the final 62 regular season games). Exhibit A:

And Exhibit B:

Seeing it laid out like this serves as a good reminder of why we prioritize the process over the results for the purposes of forecasting future performance. Whereas there’s clearly a pretty strong positive relationship in shot-based metrics in-season after a certain point (in this case ~20 games), goal-based measures are far more volatile. Teams that have been consistently dominating the shot counter will probably continue to do so moving forward. We’ve seen that borne out over the past decade’s worth of hockey. Whether a team that’s been coming out ahead in goals early on will continue to do so is dependant on a bunch of different factors, and far more uncertain.
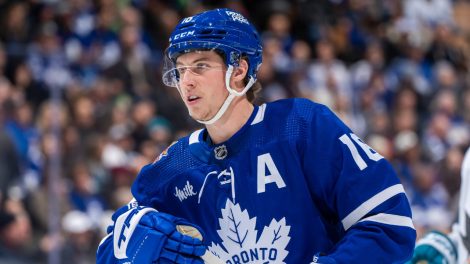
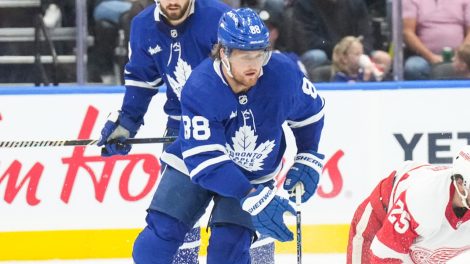
One reason for this is because of the sheer disparity in raw volume between the two. Take a team like the Toronto Maple Leafs, who have been amongst the most high-event five-on-five teams all year. They’ve had north of 1,500 shot attempts (1,503 to be exact) registered thus far between them and their opponents in the 15 games they’ve played, with only of 71 of them actually finding the back of the net.
While it seems reasonable to suggest that they’ll at least be an above average puck possession team because of the baseline they’ve established for themselves, a couple of better bounces here or there that result in goals would dramatically influence their fourth-worst goal differential and overall outlook. Getting an eventual save or two from their goalies would certainly help.
They’re not the only ones with a sizeable discrepancy between how well they’ve played and what they have to show for their efforts.
| TEAM | EXPECTED GOALS FOR % | GOALS FOR % | DIFFERENCE |
|---|---|---|---|
| CHI | 48.23 | 68.1 | 19.87 |
| MTL | 50.19 | 63.83 | 13.64 |
| CBJ | 46.03 | 57.68 | 11.65 |
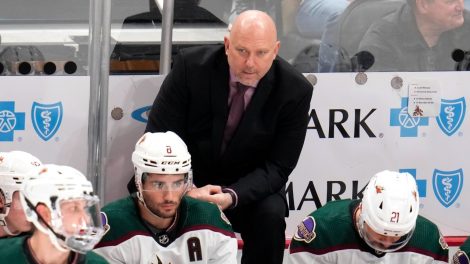
| ARI | 39.82 | 47.05 | 7.23 |
| WSH | 53.55 | 60.02 | 6.47 |
| DET | 47.28 | 53.54 | 6.26 |
| MIN | 53.61 | 59.77 | 6.16 |
| N.J. | 49.4 | 55.24 | 5.84 |
| NYR | 54.65 | 60.22 | 5.57 |
| FLA | 52.14 | 46.76 | -5.38 |
| VAN | 44.45 | 38.97 | -5.48 |
| OTT | 49.85 | 43.76 | -6.09 |
| S.J. | 53.92 | 54.23 | -8.7 |
| CAR | 54.23 | 45.19 | -9.04 |
| TOR | 51.85 | 42.22 | -9.63 |
| COL | 47.59 | 35.62 | -11.97 |
| STL | 53.03 | 39.96 | -13.07 |
Aside from the irony of the Colorado Avalanche morphing into a sympathetic team that hasn’t been able to catch a break after years of being the exact opposite, there’s some interesting individual cases here.
The Blackhawks currently sit atop the Western Conference with their 11-3-2 record and plus-15 goal differential, but look like a team that’s poised to precipitously tumble back down to earth sooner rather than later. While it’s true that Corey Crawford is a fantastic goaltender who perpetually goes underappreciated because of some of the other names on his own team, it’s also true that he’s playing over his head right now.
He’s stopped an obscene 97% of the 5-on-5 shots he’s faced this season despite facing the third-heaviest workload of any goalie in the league. To put that into perspective, he’s been a ~.930 5-on-5 save % guy for his career up until this point. The difference between those two marks is worth roughly 11 or 12 goals, or the same as the difference between the Montreal Canadiens (read: Carey Price) and the Carolina Hurricanes (read: Cam Ward) this season. For what it’s worth, since 2007 no goalie has stopped more than 95% of the shots he’s faced in those situations over a full season, with Tim Thomas (.949 in 2010-11 and .945 in 2008-09) coming the closest to breaking that threshold.
On the other end of the spectrum, two teams that fancy themselves contenders — the Blues and the Sharks — appear to be lying in the weeds right now. There’s nothing in their shot or scoring chance numbers to suggest they’ve taken a step back. St. Louis is second in shots and 11th in chances, while San Jose is seventh and fourth in those two categories respectively.
The reason why their records look relatively pedestrian at this point in time is mostly because they find themselves in the bottom-six of both shooting percentage and save percentage. Considering they’re two teams that didn’t get demonstrably worse over the summer by any means, the most logical explanation for this is that it’s a blip in the radar that’s bound to even out eventually. And when it does, they’ll be right back near the top of the standings like we’ve come to expect.
It’s obviously still early enough in the season that things can change. The major caveat to all of this is that personnel changes like trades, injuries, and AHL call-ups can happen, which should force us to recalibrate our beliefs.
The same goes for coaching changes. Just last year we saw two prominent teams dramatically improve their underlying numbers and overall performances in-season because of moves behind the bench. For the Penguins, that was accomplished by replacing Mike Johnston with the forward-thinking Mike Sullivan. They were controlling 48.2% of the shots at the time of the switch and wound up seeing that rate skyrocket all the way up to 55.3% in the games under their new coach. For the Ducks, they didn’t change their coach, but they did make fundamental adjustments to their system and the way they played as a team.
At this point in the season, teams should already be looking in the mirror and critically evaluating their performance. There’s enough time left on the schedule to make the requisite adjustments and change the trajectory of the season. Barring those moves, it’d be foolish to expect things to turn just because it’s still early. By now we’ve seen enough hockey in 2016-17 to at least have a decent grasp of who’s actually good and who isn’t.